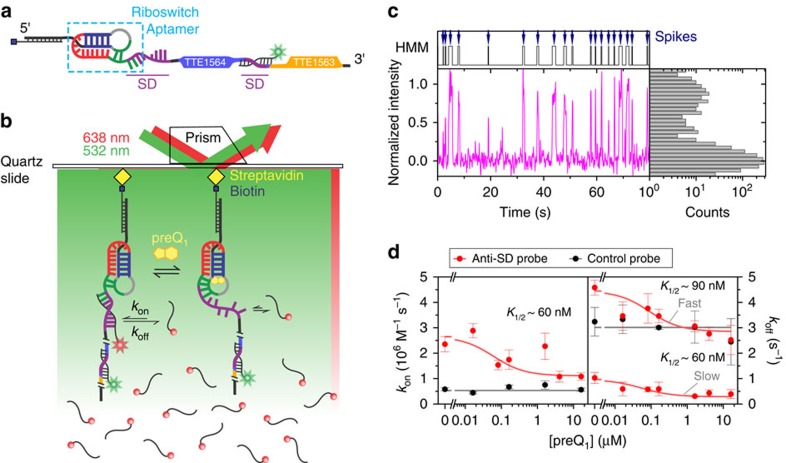
Figure 2. SiM-KARTS measurements of preQ1-dependent anti-SD-binding kinetics.
(a) The Tte mRNA complex used in SiM-KARTS experiments. Full-length Tte mRNA molecules are immobilized to the slide surface via a biotinylated-capture strand that is hybridized to the 5′ end of the mRNA. Features of the riboswitch and associated reading frames are coloured as in Fig. 1a,b, respectively. A TYE563-LNA (with green star) is hybridized to the start of the downstream open reading frame to occlude this second SD sequence and to locate mRNAs on the slide surface. (b) Experimental prism-based TIRFM set-up. The Tte mRNA complexes shown in a are immobilized to a slide surface that has been passivated with biotinylated BSA (omitted for clarity). Repeated binding and dissociation of the anti-SD probe labelled with Cy5 (red sphere, red star) is monitored through co-localization of TYE563 and Cy5 fluorescence. (c) Representative anti-SD probe-binding fluorescence versus time trajectory and corresponding fluorescence intensity histogram for a single Tte mRNA molecule in the absence of preQ1. Cy5 intensity from the anti-SD probe (magenta) and Hidden Markov idealization to a two-state model (HMM, grey) are plotted as a function of time. The TYE563 fluorescence trace used to identify and localize the Tte mRNA has been omitted for clarity. (d) Anti-SD (red) and control (black) probe binding and dissociation rate constants (kon, left plot; koff, right plot) were determined from exponential fits of dwell times in the unbound and bound states, respectively, as a function of preQ1 concentration. Binding and dissociation rate constants for the control probe are unaffected by preQ1 concentration. The corresponding K1/2 value from the saturation curve fit of the anti-SD probe binding is indicated. The results represent the average±s.e.m. of at least three independent experiments.

