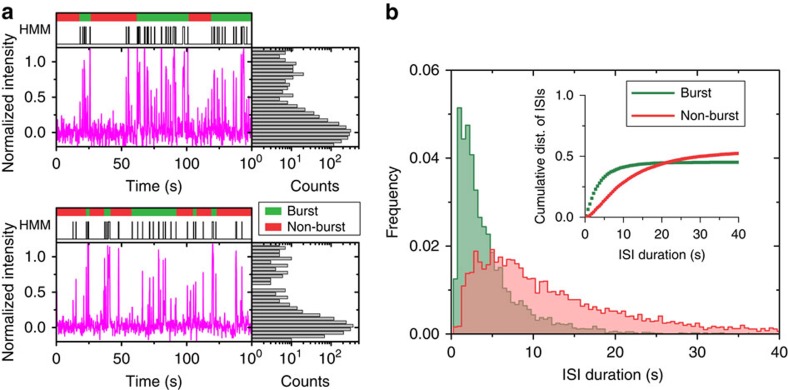
Figure 3. Detection of burst behaviour through spike train analysis.
(a) Representative trajectories as in Fig. 2b for two single Tte mRNA molecules in the absence of preQ1, annotated with bursts (green bars) and non-burst periods (red bars) detected through spike train analysis. (b) Cumulative histogram displaying the distribution of ISIs during burst (green) and non-burst (red) periods in the absence of preQ1.

