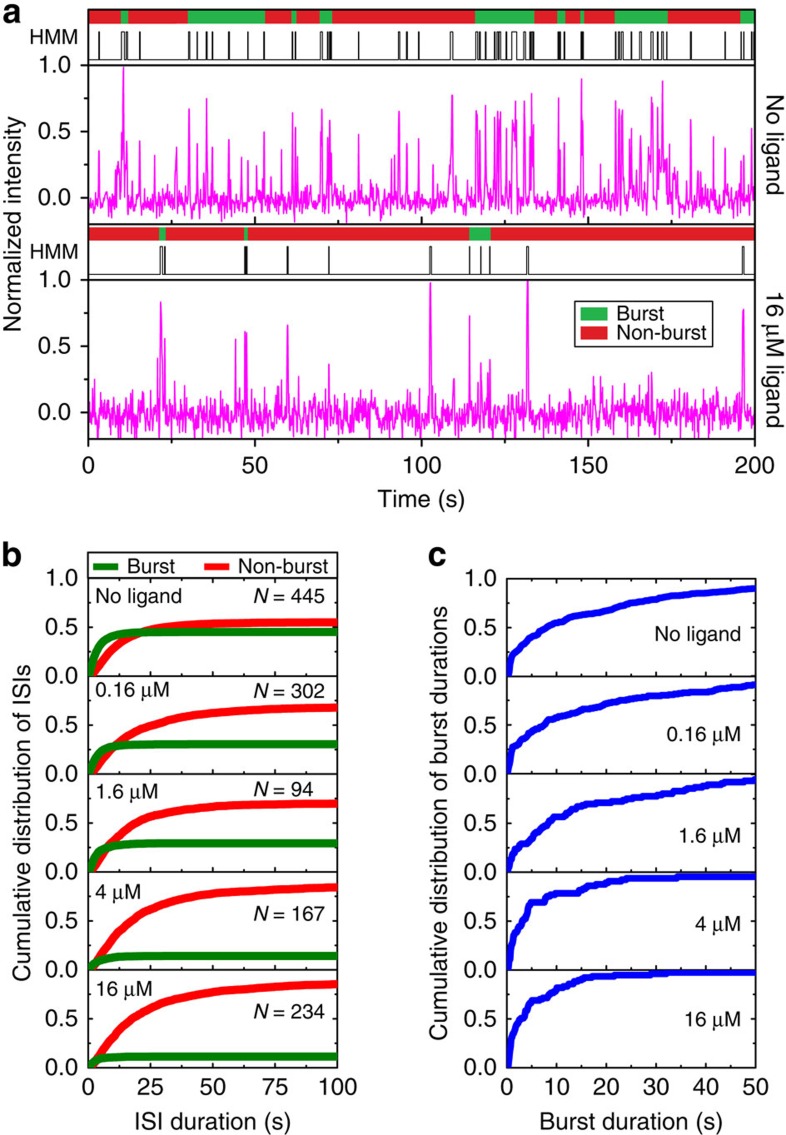
Figure 4. Ligand-dependent changes in bursting behaviour of single riboswitches.
(a) Single-molecule trajectories as in Fig. 3a but in the absence and presence of saturating preQ1 (top and bottom, respectively). (b) Cumulative distribution plots indicating the distribution of ISIs during burst (green) and non-burst (red) periods at varying preQ1 concentrations, where N is number of molecules included in the analysis. (c) Cumulative distribution plots of burst duration for the molecules in b as a function of preQ1 concentration. As preQ1 concentration increases, the average burst duration decreases.

