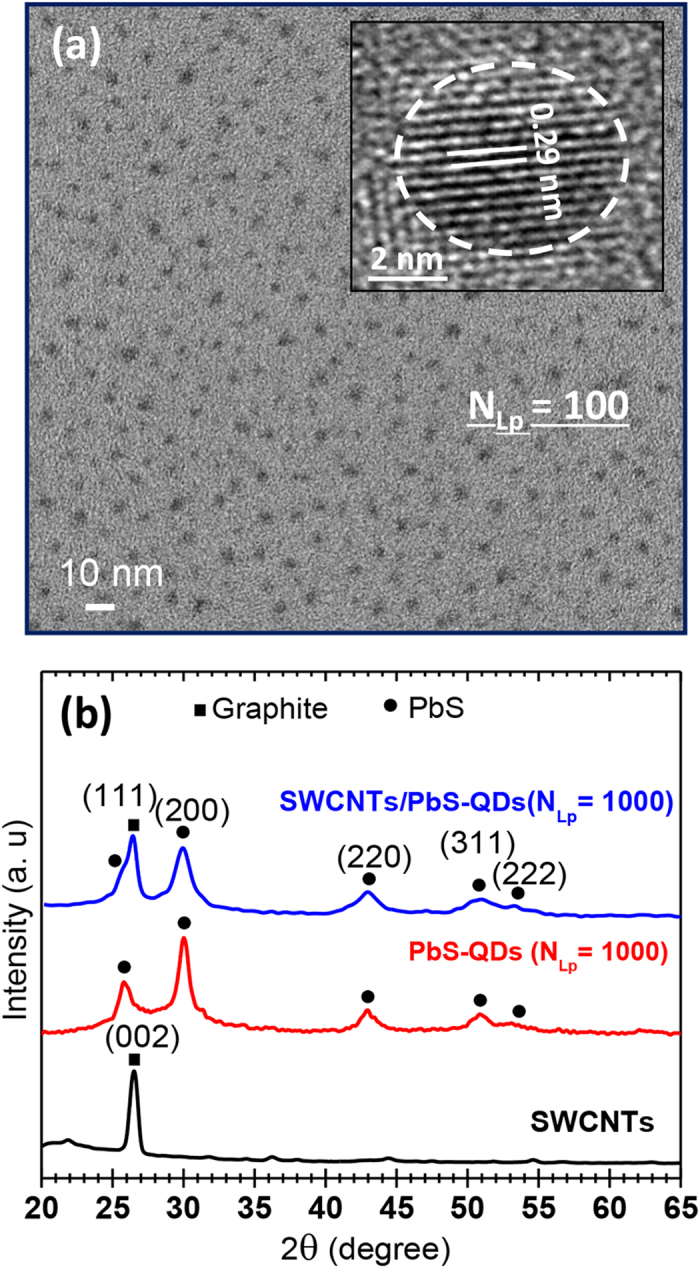
Figure 1. TEM and XRD measurements.

(a) TEM image of isolated PbS-QDs PLD-deposited directly on a TEM grid at NLp = 100. (b) XRD spectra of the SWCNTs film, of the PbS-QDs (at NLp = 1000) and of the SWCNTs/PbS-QDs nanohybrid (at NLp = 1000) deposited on Si substrates.
