
Figure 2. Raman spectra and SEM observation.
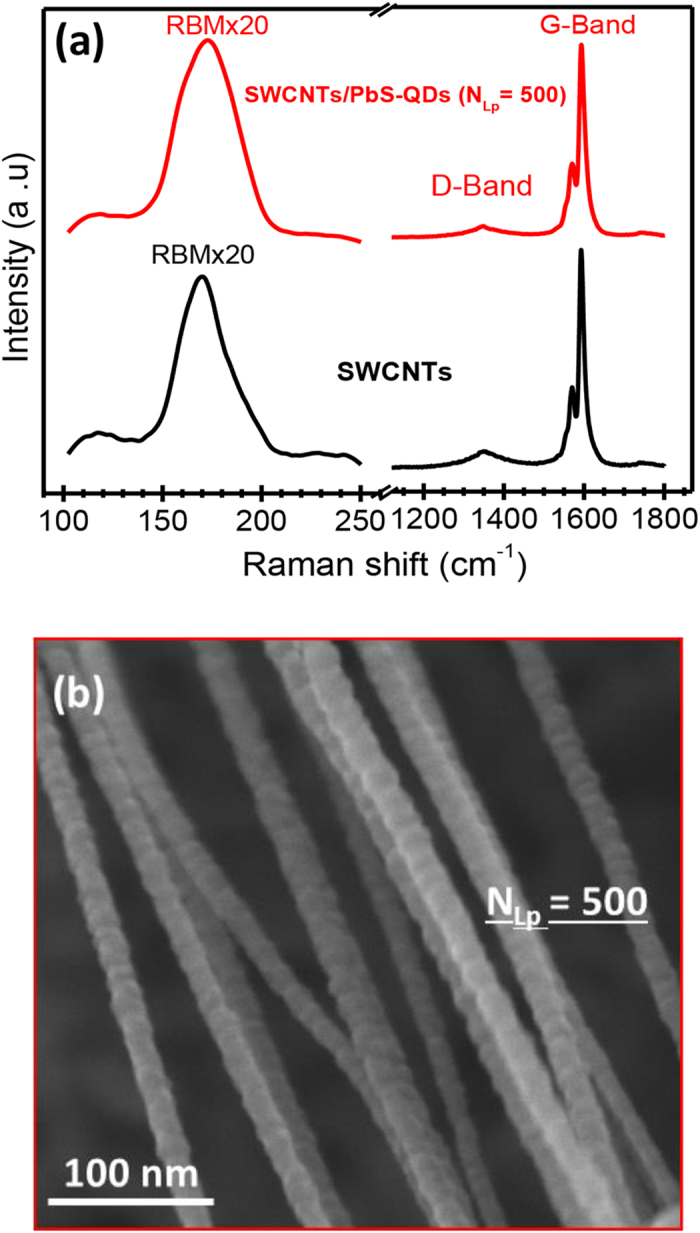
(a) Raman spectra of the SWCNTs film and of the SWCNTs/PbS-QDs (at NLp = 500) NHs. (b) Typical SEM image of the NHs consisting of SWCNTs bundles completely covered by PbS-QDs (PLD-deposited at NLp = 500).
Official websites use .gov
A
.gov website belongs to an official
government organization in the United States.
Secure .gov websites use HTTPS
A lock (
) or https:// means you've safely
connected to the .gov website. Share sensitive
information only on official, secure websites.
(a) Raman spectra of the SWCNTs film and of the SWCNTs/PbS-QDs (at NLp = 500) NHs. (b) Typical SEM image of the NHs consisting of SWCNTs bundles completely covered by PbS-QDs (PLD-deposited at NLp = 500).