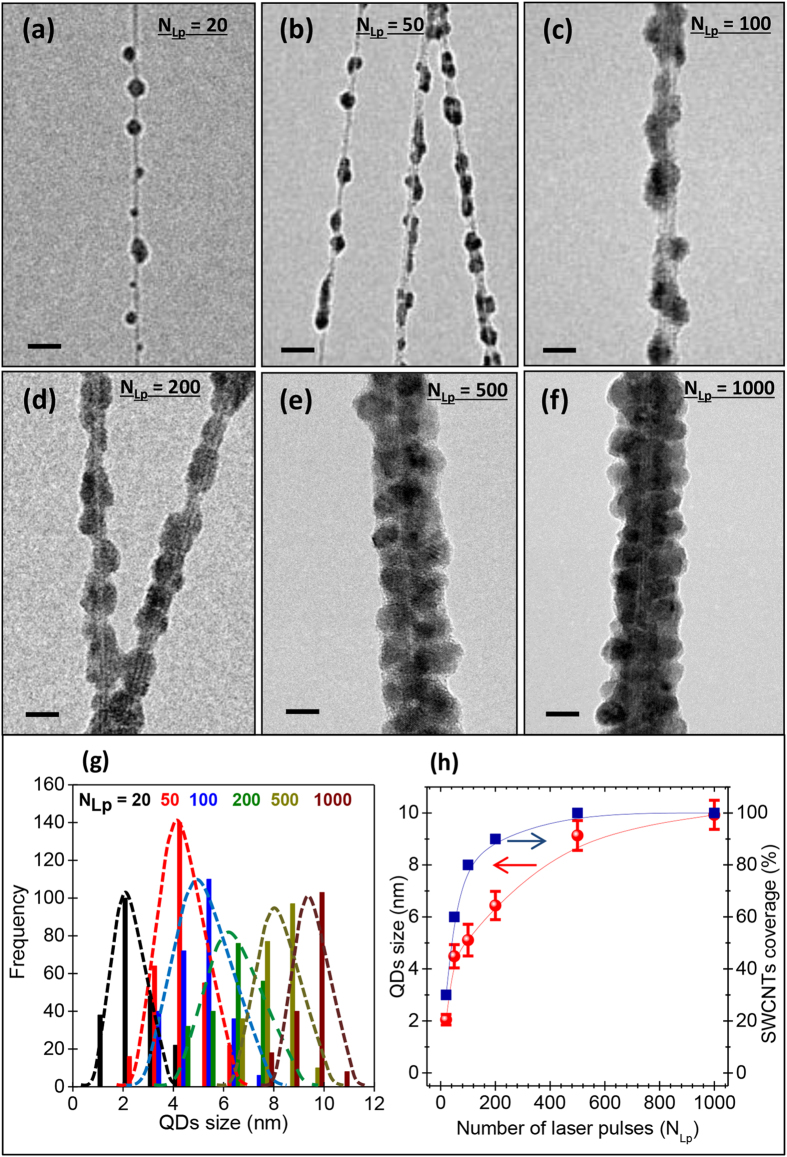
Figure 3. TEM imaging and size distributions of the PLD deposited PbS-QDs.
(a–f) TEM images of SWCNTs/PbS-QDs nanohybrids made with NLp varying from 20 to 1000; (scale bar = 10 nm). (g) Histograms of size distributions of the QDs at different NLp values, as derived from TEM images. (h) Variation of the QD size and average surface coverage of the SWCNTs by the PbS-QDs, as a function of NLp.

