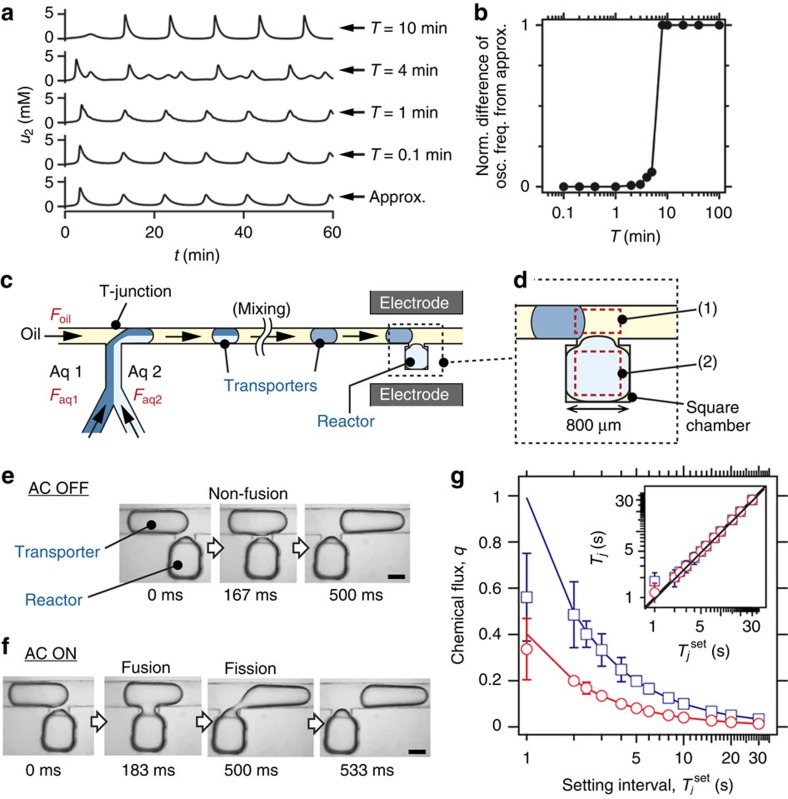
Figure 2. Characterization of the droplet open-reactor system.
(a) Results of numerical simulations of the autocatalytic reaction shown by equation (2) in the droplet open-reactor system. The simulations were performed using the general form indicated by equation (1) for T=0.1–10 min, and using the approximate form described in equation (6) for ‘approx.' (details are given in the Methods section). Tj=T and wj=w for all j. w/T=0.25 (fixed), which results in oscillation. (b) Normalized (Norm.) difference of the oscillation (osc.) frequency (freq.) from ‘approx.' in a. The value 0 indicates no frequency shift, whereas 1 means that the oscillation frequency is equivalent to the frequency of the fusion 1/T. Details are given in the Methods section. The solid line is provided as a guide for the eyes. (c) Design overview of the microfluidic system (details are given in Supplementary Fig. 2). Channel height, 500 μm. Foil, flow rate of the oil phase; Faq1 and Faq2, flow rate of the aqueous phases 1 and 2. (d) Enlarged view of the transporter and the reactor. The boxes outlined in red dashed lines indicate the areas in which (1) the detection of the transporter and (2) the fluorescence observation of the reactor were performed. (e,f) Bright-field microscope images of a fusion and fission event of a transporter and the reactor without and with a.c. voltage, respectively. Scale bars, 500 μm. (g) Control of q by Tjset. Inset: control of Tj by Tjset. The blue, red and black solid lines represent ideal values. Error bars: s.d. Sample size: 30 measurements. Foil=30 μl min−1 for e and f. Foil=15 μl min−1 (blue open square, w=0.99 s) and 30 μl min−1 (red open circle, w=0.40 s) for g. Solutions in the transporter and reactor were water for e and f, and 0.1-mM Fl–Na for g.

