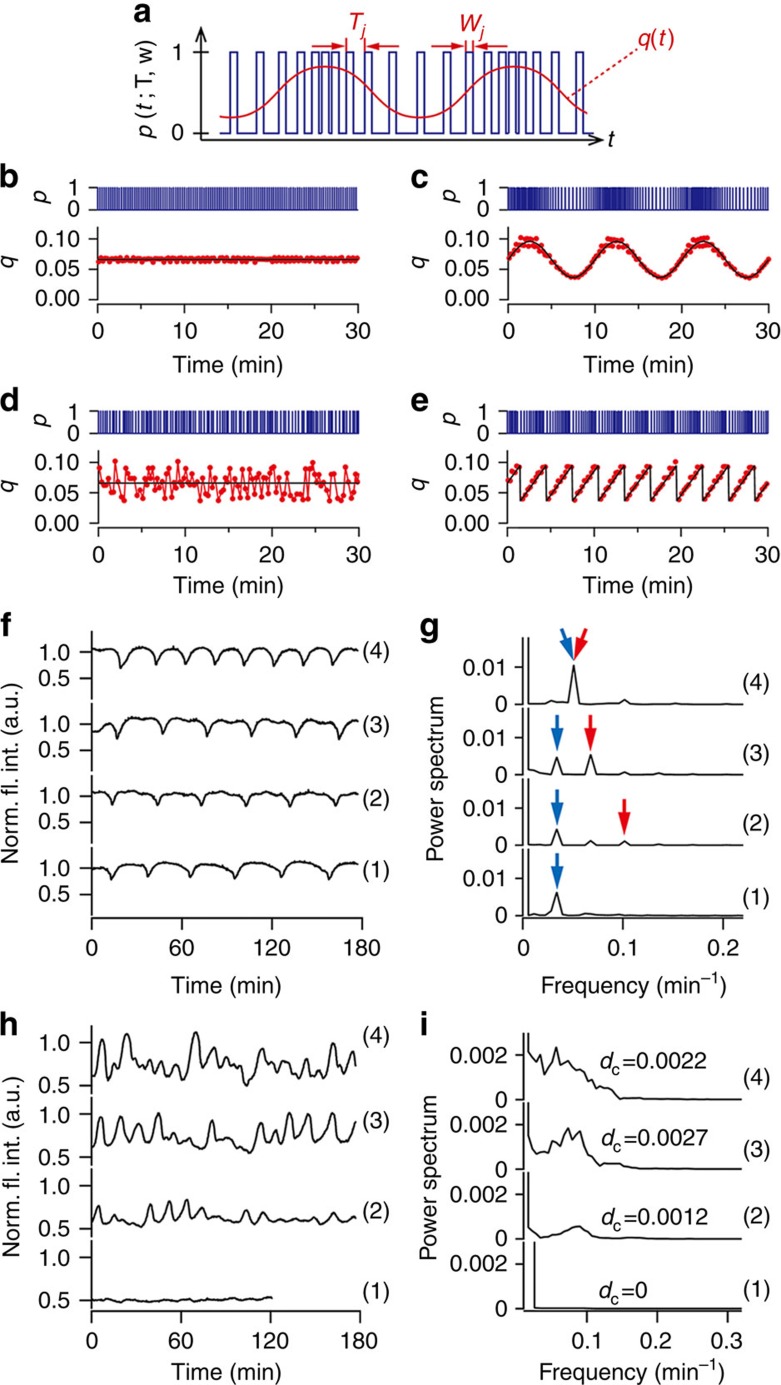
Figure 4. Time-variable external control of chemical oscillation dynamics using the droplet open-reactor system.
(a) Schematic diagram of the pulse-density modulation control of time-variable q(t). When the pulse train of p(t; T, w) is denser, q(t) is higher, and vice versa. (b–e) Generation of p and q. Blue lines: pulse trains of p(t; T, w); black lines: (b,c,e) theoretical curves of q(t) and (d) theoretical average of q(t); red dots and lines: q(t) generated in experiments, calculated as q(t=τj)=wj/Tj. wj=0.99 s (fixed for all j). (b) Constant (ZC(t)). (c) Sinusoidal wave (ZS(t), Aq=0.45, Tq=10 min). (d) White noise (ZN(t), Aq=0.45). (e) Saw-tooth wave functions (ZSt(t), Aq=0.45, Tq=3 min). ZC(t), ZS(t), ZN(t) and ZSt(t) are described in detail in the Methods section. The baseline value of q(t):  . (f) Entrainment of the chemical oscillation to the external sinusoidal signal.
  . (1) Aq=0 (without sinusoidal signal) and (2–4) Aq=0.45. (2) Tq=10 min, (3) Tq=15 min and (4) Tq=20 min. (g) Power spectra of f. (h) Noise-induced pulsed excitation when white noise was added to SSL.
  . (1) Aq=0 (without noise), (2) Aq=0.15, (3) Aq=0.3 and (4) Aq=0.45. (i) Power spectra of h.
  . The compositions of the solutions in the transporter and reactor are given in the Methods section. Norm. fl. int., normalized fluorescence intensity.

