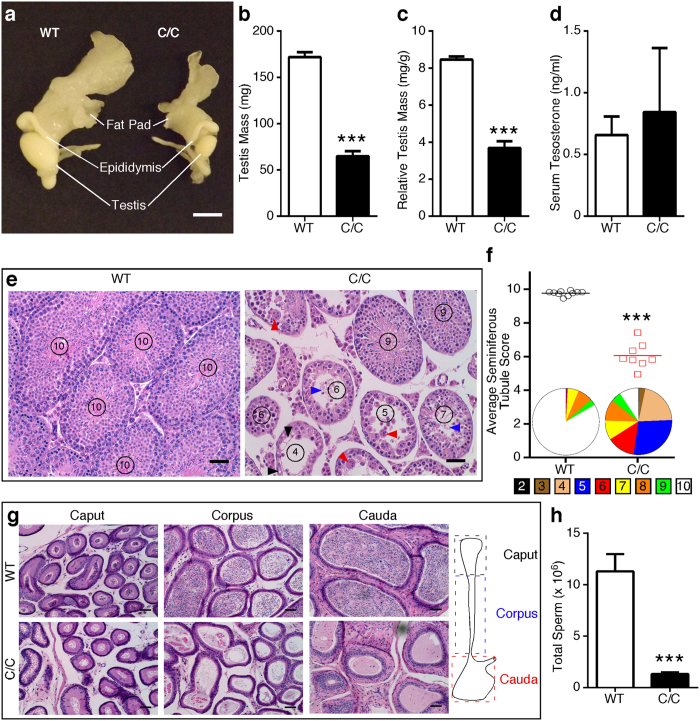
Figure 1. Male reproductive organs and functions are abnormal in P42 C/C mice.
(a) Representative photograph of WT (left) and C/C (right) male reproductive organs, including testis, epididymis and epididymal fat pad. Scale bar represents 5 mm. (b) Gross testis mass. (c) Relative testis mass was determined by dividing gross testis mass by total body weight (n = 10 WT and 6 C/C mice). (d) Serum testosterone level determined by ELISA (n = 5 mice per genotype). (e) Representative H&E stained testis cross-sections. Circled numbers represent score of each tubule based upon a 10 point system that assesses morphology13. Damage and degeneration, including vacuolization (black arrowheads), multinucleated bodies (red arrowheads) and sloughed tissue (blue arrowheads) are indicated. Scale bars represent 50 μm. (f) Average seminiferous tubule scores for WT and C/C testes. Each point represents a single mouse (n = 10 WT and 6 C/C mice). Pie charts below data points represent the distribution of all seminiferous tubule scores for WT and C/C males. The legend underneath indicates the color for each score. (g) Representative H&E stained cross sections of epididymal regions. The cartoon to the right indicates the location of each region. Scale bars represent 50 μm. (h) Total epididymal sperm count from P60 males (n = 8 WT and 6 C/C mice). (Statistical significance: ***p < 0.001).

