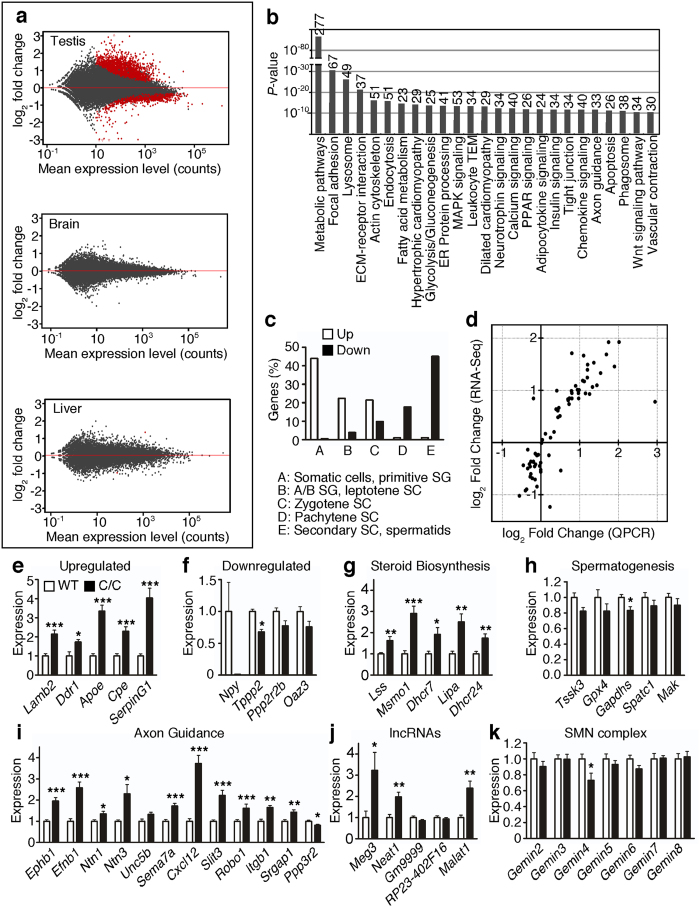
Figure 4. RNA-Seq reveals drastic alterations in C/C testis transcriptome.
(a) MA plots for testis (top), brain (middle) and liver (bottom). The y-axis depicts log2 fold change (LFC) in gene expression in C/C compared to WT, and the x-axis depicts the mean read count for each gene between all samples. Each dot represents one gene, with red dots representing genes with significantly altered expression values (Benjamini and Hochberg (B + H) adjusted p value <0.05). (b) KEGG pathways enriched for genes with altered expression levels in C/C testis. The length of each bar represents the B + H adjusted p value of enrichment for each pathway. The number at the top of each bar represents the number of genes participating in each pathway with significantly altered expression. (c) Percentage of genes upregulated (white bars) or downregulated (black bars) in C/C testes that are classified as being primarily expressed in certain testicular cell types. Abbreviations used: spermatogonia (SG), spermatocytes (SC). (d) LFC in C/C testes of several candidate genes as measured by RNA-Seq (y values) and QPCR (x values). (e,f) QPCR showing aberrant testis expression of genes that are strongly upregulated (e) or downregulated (f). (g–i) QPCR for select genes involved in steroid biosynthesis (g), spermatogenesis (h) and axon guidance (i). (j) QPCR for expression of lncRNAs. (k) QPCR for expression of genes that encode members of the SMN complex. For (e–k), n = 8 mice per genotype (Statistical significance: *p < 0.05; **p < 0.01; ***p < 0.001).

