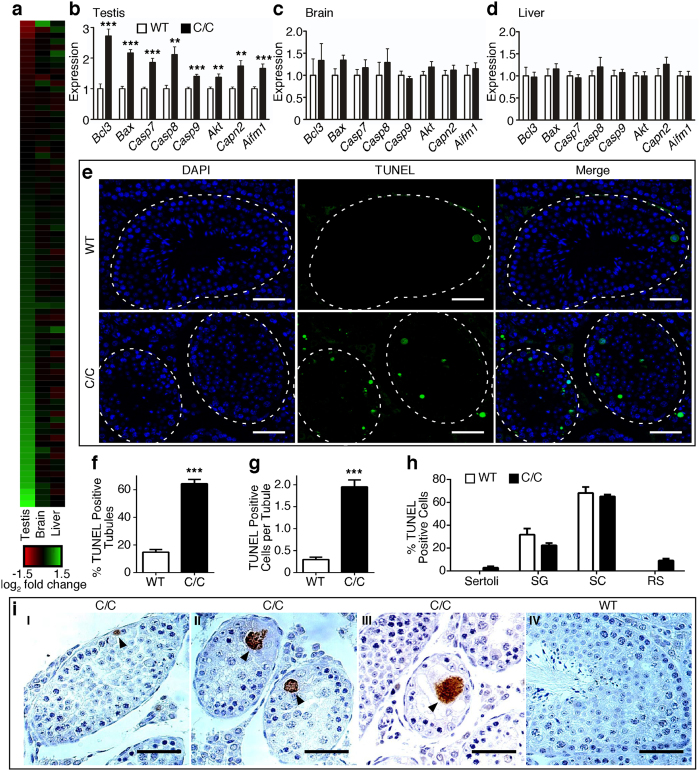
Figure 5. Expression of apoptosis-related genes is disproportionally affected in C/C testes.
(a) Heat map depicting the relative expression of every gene involved in apoptosis, as annotated by the Kyoto Encyclopedia of Genes and Genomes. Each colored bar indicates the LFC of expression in C/C compared to WT. The color scale is indicated below, with red colored bars indicating genes with lower expression in C/C and green colored bars indicating genes with increased expression in C/C. (b–d) Relative expression of several candidate genes involved in apoptosis, as measured by QPCR in testes (b), brain (c) and liver (d); n = 4 mice per genotype. (e) Representative micrographs from TUNEL assay showing nuclei (DAPI, blue), TUNEL signal (green) and merged image. Individual seminiferous tubules are noted with dashed white outline. Scale bars represent 50 μm. (f) Percentage of seminiferous tubules with at least one TUNEL-positive cell. (g) Average number of TUNEL positive cells per seminiferous tubules. (h) Percentage of TUNEL-positive cells classified by cell type, including Sertoli cells, spermatogonia (SG), spermatocytes (SC) and round spermatids (RS). For (f–h), n = 4 mice per genotype. (i) Representative images of cleaved caspse 3 immunostaining. C/C testes with cleaved caspase 3-positive spermatogonia (panel I), spermatocytes (panel II) and multinucleated body (panel III) are indicated by arrowheads. WT testes showed absence of cleaved caspase 3 (panel IV). Scale bars represent 50 μm. (Statistical significance: *p < 0.05; **p < 0.01; ***p < 0.001).

