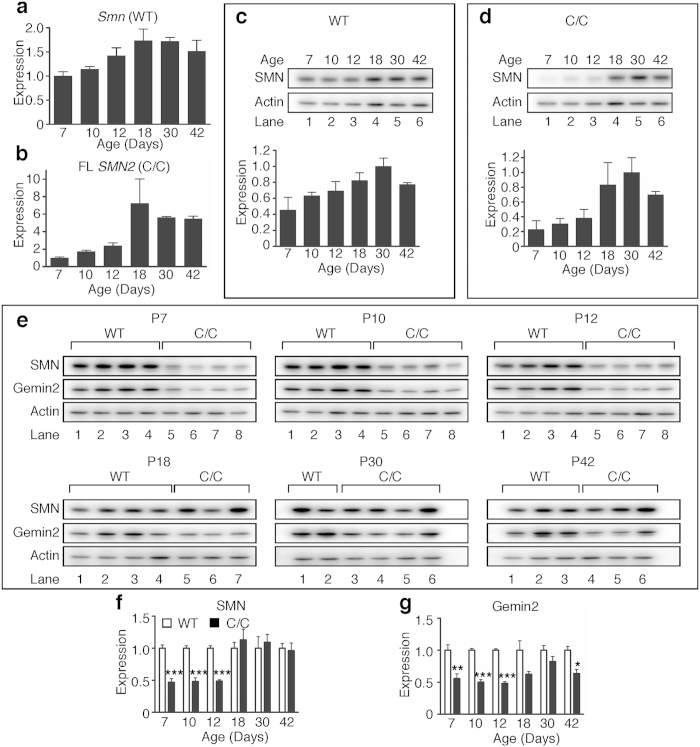
Figure 7. SMN mRNA and protein expression during testis development.
(a,b) QPCR measurement of relative quantities of Smn transcript in WT testes (a) and FL (including both exons 5 and 7) SMN2 transcript in C/C testes (b) during development. Expression is calculated relative to the average expression level at P7. (c,d) Time course of SMN protein expression in WT (c) and C/C (d) mice. Blots shown are representative examples of each time point. (e) SMN, Gemin2 and Actin expression in WT and C/C testes during development for each age. (f) Densitometric analysis for SMN western blots shown in (e). (g) Densitometric analysis for Gemin2 western blots shown in (e). N = 2–4 mice per genotype and age. (Statistical significance: *p < 0.05; **p < 0.01; ***p < 0.001).

