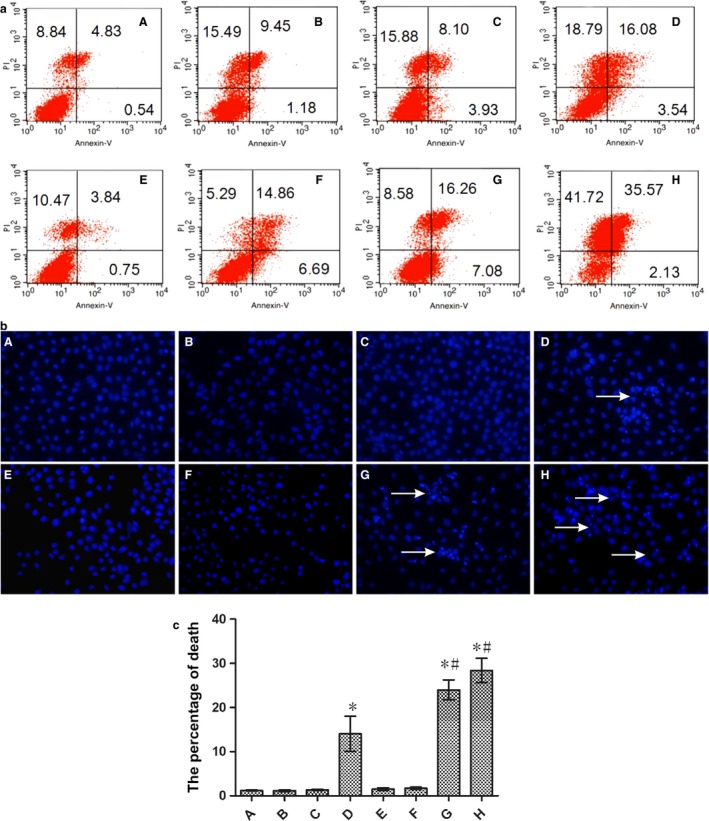
Figure 6.

(a) Apoptosis of nano‐AE (aloe emodin–encapsulated nanoliposomes)‐mediated r‐caspase‐3 gene transfection and photodynamic therapy (PDT) on gastric cancer cells (6.4 J/cm2). (b) Morphological changes in the cell nuclei undergoing nano‐AE‐mediated r‐caspase‐3 gene transfection and PDT on gastric cancer cells (6.4 J/cm2). (c) The percentage of death quantified by the Hoechst stain. A: blank control; B: pDNA group; C: nano‐AE group; D: nano‐AE transfection group; E: pure light group; F: pDNA and light group; G: nano‐AE PDT group; H: nano‐AE transfection and PDT group. *P < 0.05, Group D/G/H versus Group A. #P < 0.05, Group G/H versus Group D. Values are mean ± SD of three independent determinations.
