
Figure 2.
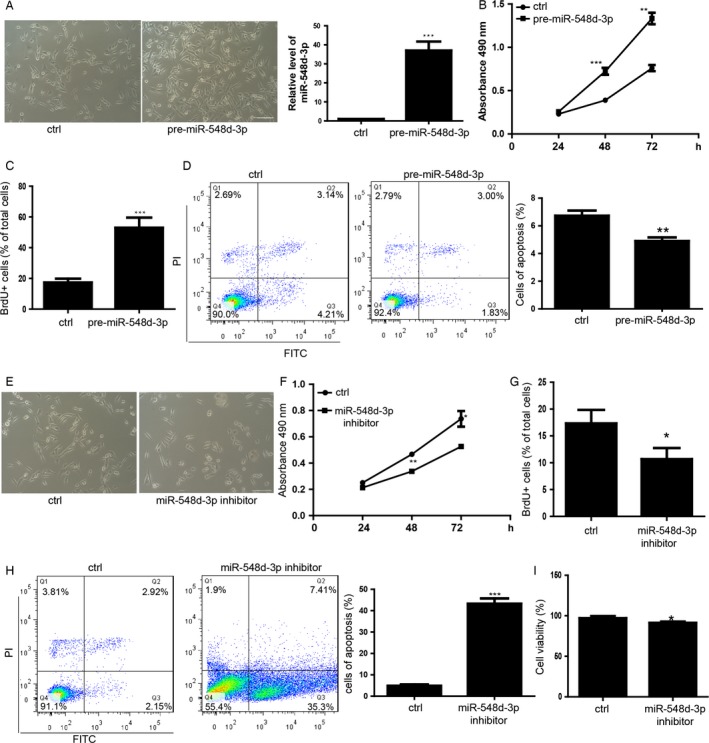
miR‐548d‐3p plays an important role on regulating the proliferation and apoptosis of MDA‐MB‐231 cells. (A) Morphology of MDA‐MB‐231 cells transfected with the pre‐miR‐548d‐3p and control miRNA. The scale bar represents 100 μm. The bottom panel is the effect of transfection of pre‐mir‐548d‐3p in mDA‐MB‐231 cells. Data shown are means ± SD (n = 5). ***P < 0.001 versus the corresponding control. (B) MTS assay about the proliferation of MDA‐MB‐231 cells during the 24, 48, 72 h. Data shown are means ± SD (n = 3). **P < 0.01,***P < 0.001 versus the corresponding control. (C) Statistics of the BrdU positive cells by BrdU pulse (2 h). n = 100 cells, average ± SD, ***P < 0.001. (D) Apoptosis analysis of MDA‐MB‐231 cells. Bottom panel showed the statistics of apoptosis. (E) Morphology of MDA‐MB‐231 cells transfected with the miR‐548d‐3p and control miRNA. (F) The proliferation analysis of MDA‐MB‐231. Data shown are means ± SD (n = 3). *P < 0.05,**P < 0.01 versus the corresponding control. (G) Statistics of the BrdU positive cells. n = 100 cells, average ± SD, *P < 0.05. (H) Apoptosis analysis of MDA‐MB‐231 cells. Right panel showed the statistics of apoptosis. Data shown are means ± SD (n = 3). ***P < 0.01 versus the corresponding control. (I) Statistics of death status of cells treated by sevoflurane or control by trypan staining. Data shown are means ± SD (n = 4). *P < 0.05 versus the corresponding control.