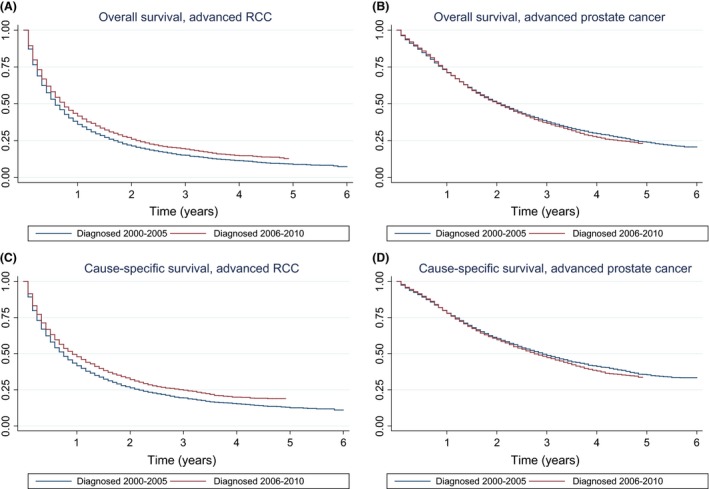
Figure 1.

(A) Kaplan–Meier curves of overall survival (in years) for study group of advanced RCC patients diagnosed in 2000–2005 versus those diagnosed in 2006–2010. The difference in survival times between pretargeted therapy era and targeted therapy era was statistically significant (P < 0.01) based on Cox regression. (B) Kaplan–Meier curves of overall survival (in years) for control group of advanced prostate cancer patients diagnosed in 2000–2005 versus those diagnosed in 2006–2010. The difference in survival times between pretargeted therapy era and targeted therapy era was not statistically significant (P = 0.25) based on Cox regression. (C) Kaplan–Meier curves of cause‐specific survival (in years) for study group of advanced RCC patients diagnosed in 2000–2005 versus those diagnosed in 2006–2010. The difference in survival times between pretargeted therapy era and targeted therapy era was statistically significant (P < 0.01) based on Cox regression. (D) Kaplan–Meier curves of cause‐specific survival (in years) for control group of advanced prostate cancer patients diagnosed in 2000–2005 versus those diagnosed in 2006–2010. The difference in survival times between pretargeted therapy era and targeted therapy era was not statistically significant (P = 0.08) based on Cox regression.
