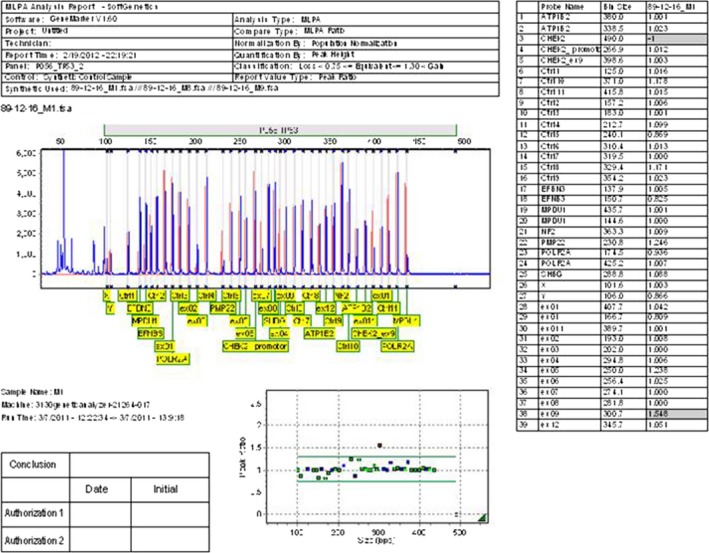
Figure 4.

The multiplex ligation‐dependent probe amplification (MLPA) data shows a ratio analysis format where the X axis represents fragment size in base pairs, and the Y axis represents the probe‐height ratio. Peak pattern evaluation of TP53 in a patient with duplication on exon 9 is represented by a black horizontal line (1.548) which is larger than that of normal range (0.75–1.3).
