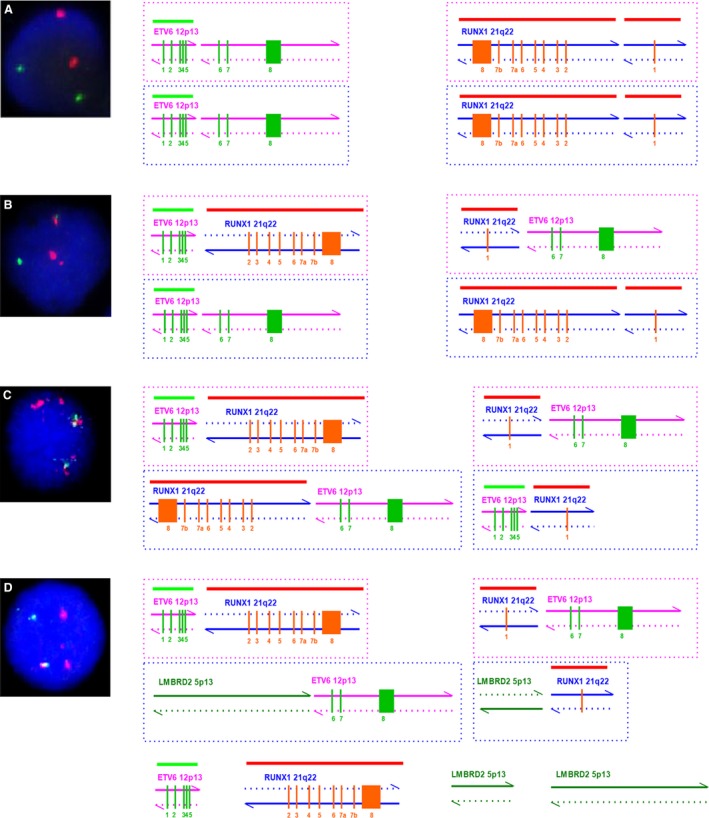
Figure 5.

FISH signal patterns. (A) FISH signal pattern for ETV6‐RUNX1‐negative cells is two green and two red. (B) FISH signal pattern for ETV6‐RUNX1‐positive cells is two red, one green, and one yellow. (C) FISH signal pattern for patient 000479 is two red and two yellow. (D) FISH signal pattern for patients with three‐way translocations is three red, one green, and one yellow.
