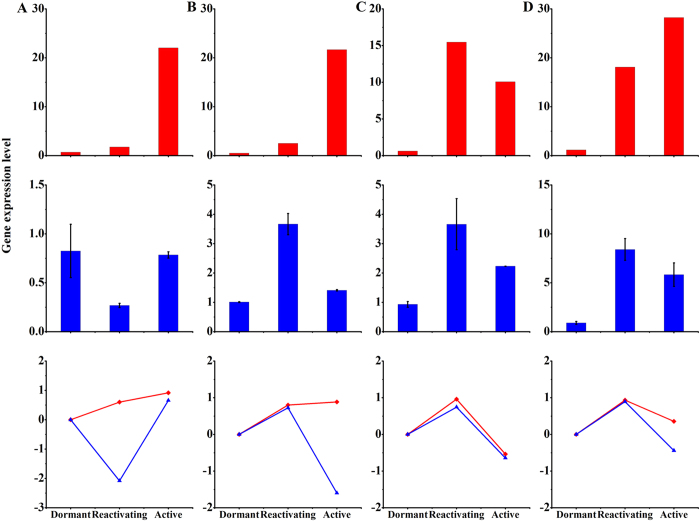
Figure 5. Expression of cell division related genes in SAM and vascular cambium.
Values of expression levels (RPKM) from RNA-seq were standardized in vascular cambium (red bars). Relative expression of bud-dormancy related genes was determined by quantitative real-time RT-PCR (blue bars). The data represent mean value ± SD from three biological replicates. Asterisk indicates significant differences (P ≤ 0.05). The Y-axes show expression levels and the (A–D) from left to right on the X-axis represent genes encoding zinc finger protein (A), R2R3-MYB transcription factor MYB2 (B), A-like cyclin (C), and ARF-L1 protein (D).The line chart indicated the variation degree of these genes between in SAM (blue lines) and vascular cambium (red lines) during the dormancy-activity transition.

