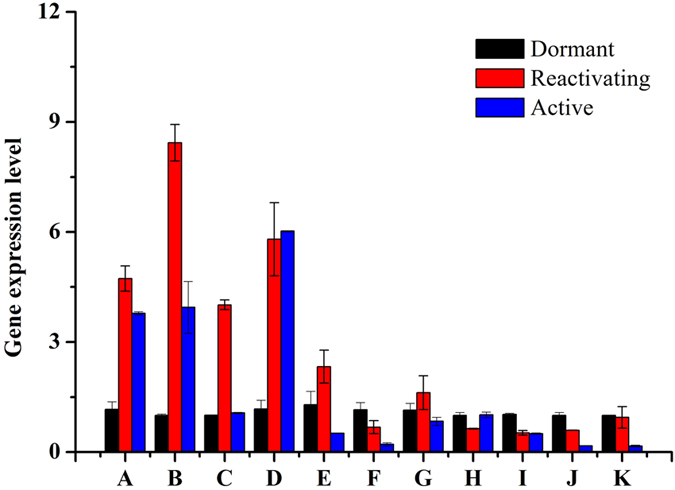
Figure 6. Genes expression in apical buds during the dormancy-activity transition.

Relative expression of bud-dormancy related genes was determined by quantitative real-time RT-PCR. The data represent mean value ± SD from three biological replicates. Asterisk indicates significant differences (P ≤ 0.05). A to K of the X axis represent putative genes beta-1,3-glucanase, xyloglucan endotransglycosylase, endo-beta-1,4-glucanase, pectate lyase, ABI3-interacting protein 2, sugar transporter family protein, peroxidase-like protein, AP2-EREBP, WRKY, Pm WRKY115, Pm WRKY 117.
