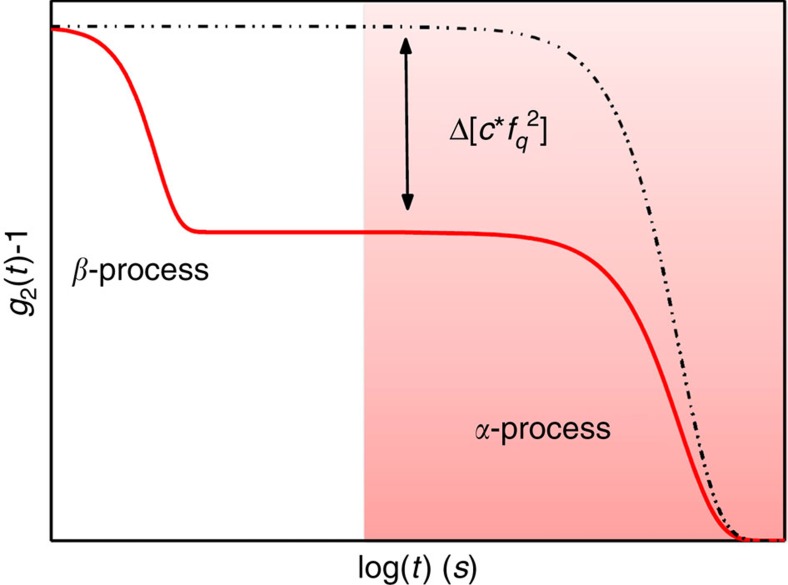
Figure 2. Decay of the intensity correlation function in presence of a secondary relaxation.
We report here the typical behaviour of the intensity correlation function as measured by XPCS in presence of a secondary relaxation process. Instead that a single decay (black dashed line), the g2 displays a first step at very short time scales associated to the secondary β-process and a second decay at much larger time scales due to the main structural relaxation process. The coloured region in the Figure represents the dynamical range investigated by XPCS, which starts from t>3 s. Here, the activation of a faster relaxation cannot be directly observed but it leads to a decrease of the initial plateau of an amount that corresponds to the strength,  , of the fast β-process.

