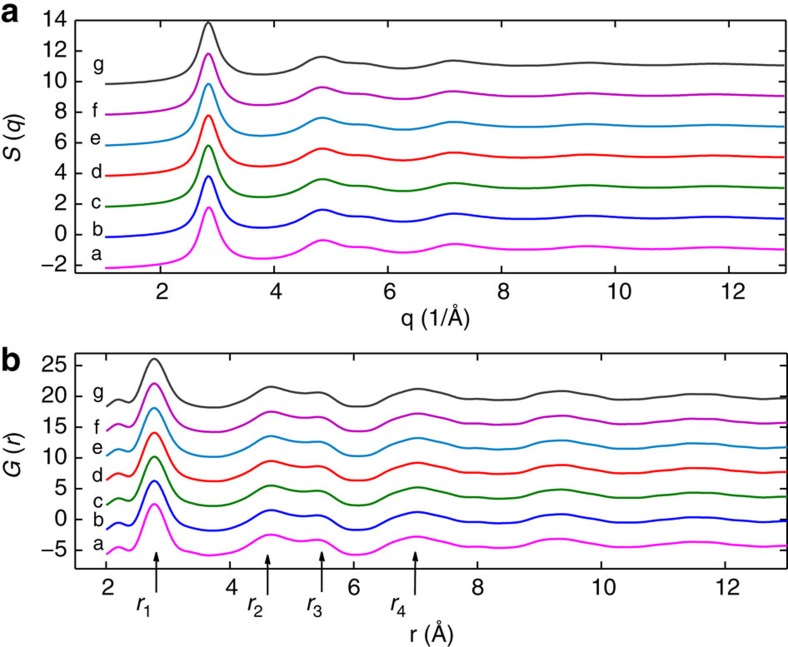
Figure 3. Structural characterization during aging and thermal treatment.
Static structure factor S(q) after background subtraction and normalization (a), and correlation function G(r) (b) are reported as a function of temperature, at the beginning of each isotherm, right after temperature equilibration. Curves labels are for different temperatures: a=298 K, b=393 K, c=433 K, d=453 K, e=473 K, f=493 K, g=513 K.

