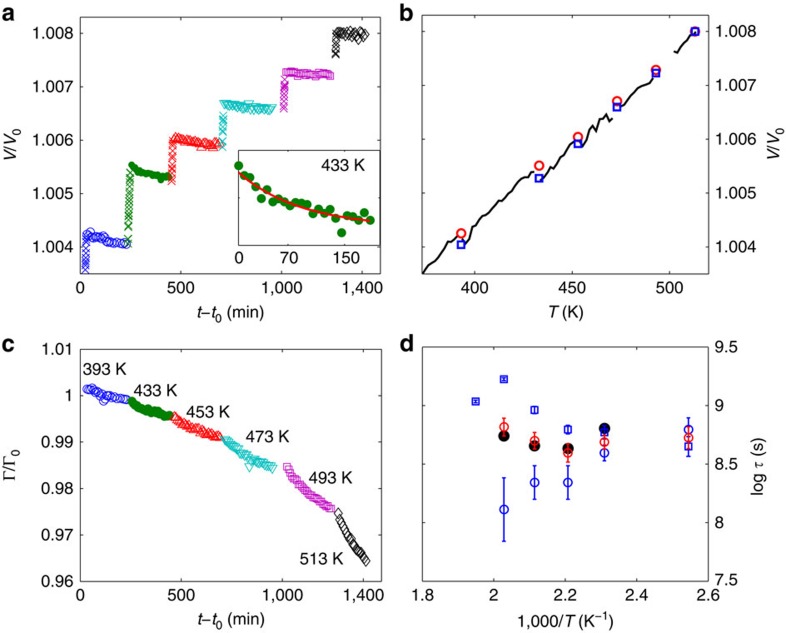
Figure 4. Aging, volume reduction and medium range ordering.
(a) Relative volume change (see text) reported as a function of t−t0. Each temperature ramp (crosses) is followed by an isotherm. Symbols are as in Fig. 1. Inset: zoom of data at 433 K reported as a function of time from the beginning of the isotherm, together with the best fit to an exponential law. (b) Relative volume change as a function of temperature. Lines: temperature ramps; empty circles and empty squares: first and last point of an isotherm, respectively. For a better visibility, we plot only data for T≥373 K. (c) Temporal evolution of the relative change of the width of the FSDP. (d) Characteristic time for aging as obtained from the volume relaxation (τV, blue empty squares), the narrowing of the FSDP (τΓ, blue empty circles) and from XPCS data (τ*, black full dots). The average of τV and τΓ is also reported (red empty circles). Error bars correspond to the error of the fitting procedure and to error propagation for the average of τV and τΓ. Where not shown, error bars are within the symbol size.

