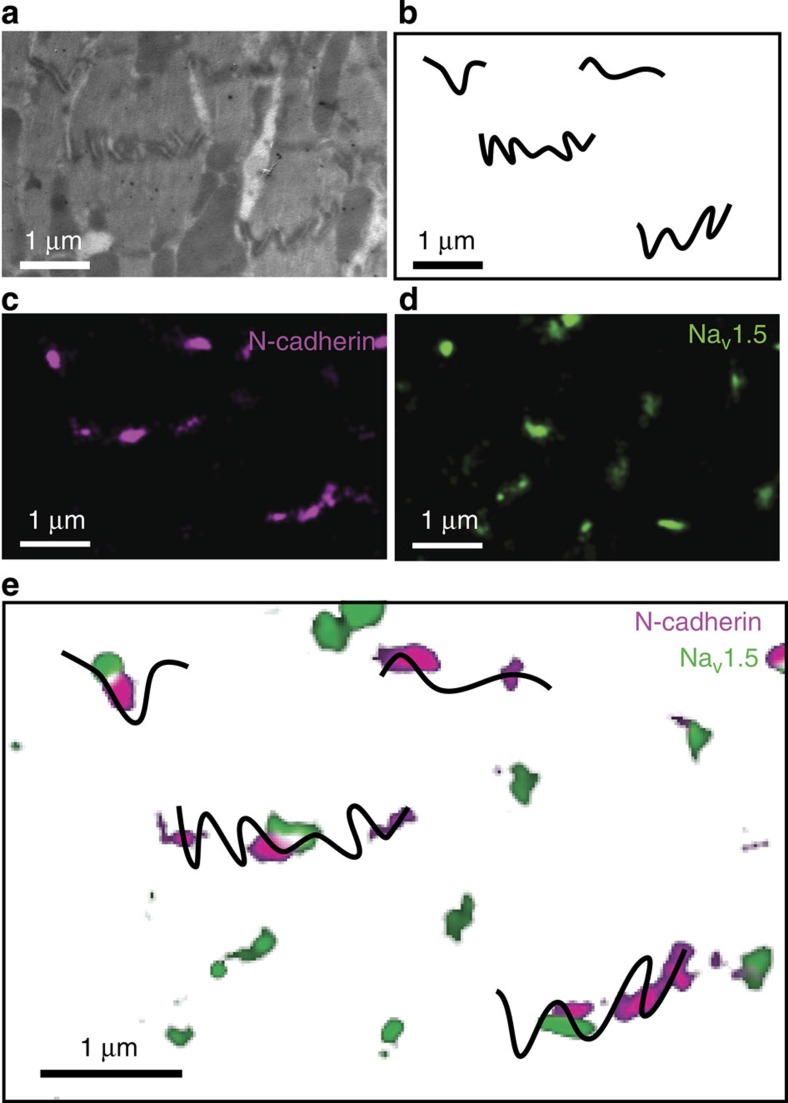
Figure 1. CLEM visualization of nodes populated by clusters of NaV1.5 and N-cadherin.
EM images of areas of intercellular contact (a) were traced for easier visualization (b). Same sample was processed for detection of N-cadherin (purple; c) and NaV1.5 (green; d) by SMLM. The EM and SMLM images were aligned by unbiased fiducial markers (see also Supplementary Fig. 1 and Methods), allowing identification of NaV1.5 clusters localized to the intercellular membrane, and their proximity to N-cadherin (e). Scale bar, 1 μm.

