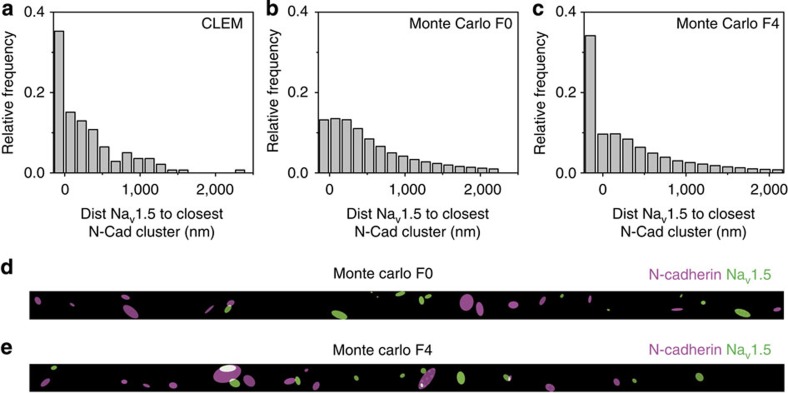
Figure 3. Quantification of inter-cluster distances from CLEM images.
(a) Histogram of distances of NaV1.5 to nearest N-cadherin cluster; n=118. Data were compared with those obtained from Monte Carlo simulations modelling either random events (b,d) or a condition in which N-cadherin acted as an attractor for NaV1.5 (c,e). Scale bar, 1 μm.

