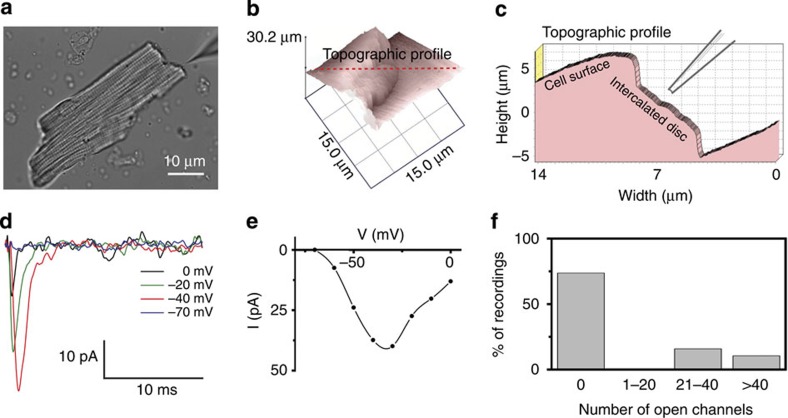
Figure 4. Functional analysis of NaV1.5 clusters in isolated mouse ventricular myocytes.
(a) Phase contrast image of a single myocyte. A recording pipette is shown on the upper right. Scale bar, 10 μm. (b) Angle view SICM-generated surface topology of cell end (see also Methods; Supplementary Fig. 11). (c) Topographic profile of the cell in B and diagram of recording site. (d) Individual INa traces obtained by angle view scanning patch clamp from the cell end (voltage steps in the inset; see also Methods). (e) Current amplitude–voltage command relation for experiment in d. (f) Summary of independent cell-attached patch recordings. Ordinates indicate per cent of total cases where a given number of channels were detected (n=20).

