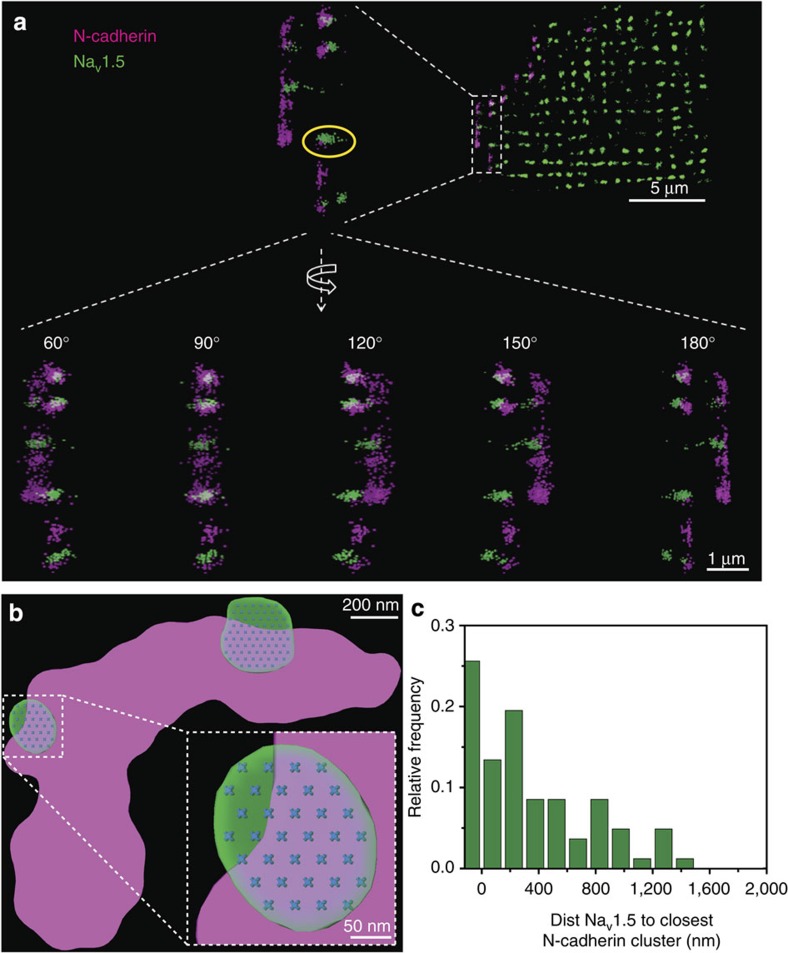
Figure 5. 3D-SMLM images from an isolated ventricular myocyte.
N-cadherin in purple, NaV1.5 in green (see also Methods and Supplementary Figs 7 and 8). (a) Region in white dotted box enlarged and shown at various angles of rotation. (top) Scale bar, 5 μm; (bottom) scale bar, 1 μm. (b) Enlarged image of a cluster of N-cadherin in contact with two clusters of NaV1.5, with the distribution of single NaV1.5 molecules, modelled as described in Supplementary Fig. 9). Scale bar, 200 nm. (inset) Scale bar, 50 nm. (c) Histogram of events. Distance between NaV1.5 and closest N-cadherin clusters. N=82.

