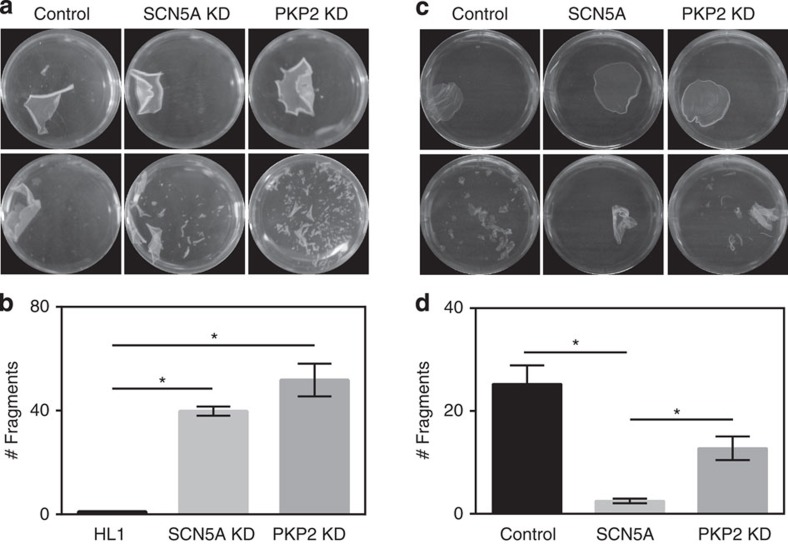
Figure 7. Dispase assay in HL1 cells.
(a) Dispase treatment caused separation of the monolayer in all cells treated (upper row). Mechanical stress following dispase (bottom row) led to the breakdown of cells lacking either NaV1.5 (middle) or plakophilin-2 (PKP2; used as a positive control for a molecule known to be fundamental in cell–cell adhesion), but not of control cells expressing endogenous levels of both proteins (left column; see also Supplementary Fig. 12). Cell plates were placed in the same shaker, motion stopped once we saw the breakdown of the PKP2-shRNA monolayer and fragments counted for all three conditions. Plate diameter is 35 mm. (b) Bar graph showing the average number of fragments recorded under the three conditions tested. N=5 for all cases. *P<0.01 by Mann–Whitney test.

