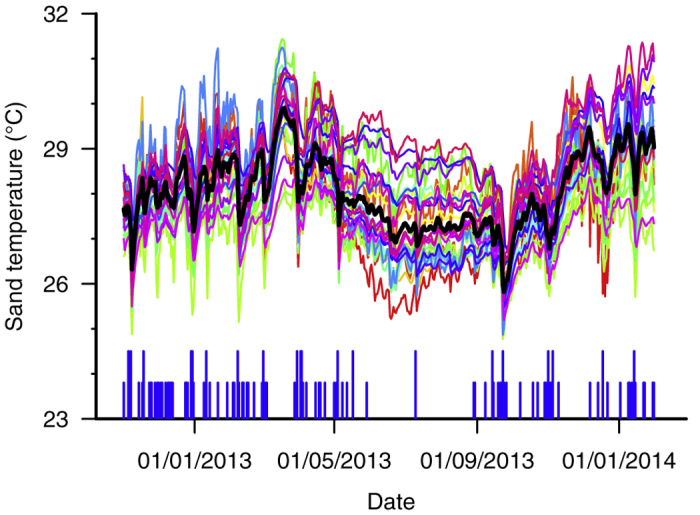
Figure 1. Sand temperatures recorded on Diego Garcia between 16 October 2012 and 6 February 2014 at nest depths (30–80 cm).

Each coloured line represents one of the 29 temperature loggers deployed and the black line represents the mean for all loggers. The short and long vertical blue lines indicate days for which precipitation was >10 mm and >50 mm respectively. Variation between loggers can be explained by the different beach zones and different depths at which the loggers were buried.
