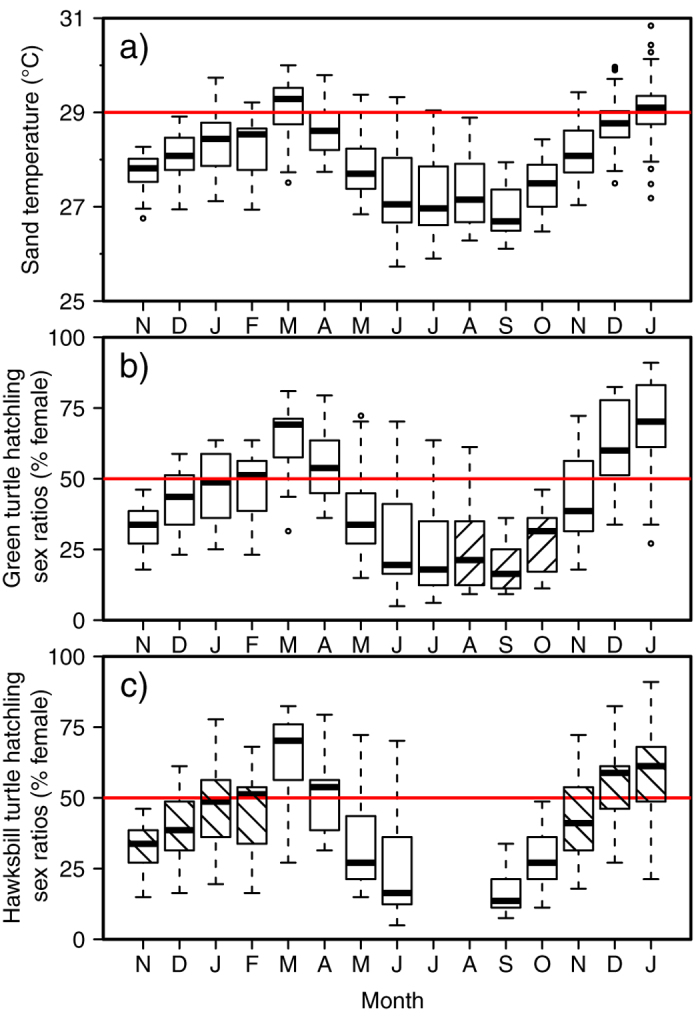
Figure 2. The mean monthly sand temperature for each of 29 loggers on Diego Garcia from November 2012 until January 2014 (excluding the months for which any days of data were missing) and the reconstructed primary sex ratios.

(a) Seasonality is shown here with lower temperatures during the months of June-October and higher temperatures during the months of December–April. The horizontal red line defines the pivotal temperature of 29 °C. (b) Green turtle hatchling production is male biased through the majority of the year. Green turtles nest throughout the year with the peak incubation period (stippled) coinciding with the coolest months of the year. (c) Hawksbills nests incubate during the months of September to June with peak incubation period (stippled) straddling the 1:1 male to female hatchling sex ratio. The horizontal line indicates the median temperature; boxes define upper and lower quartiles and whiskers show the data range; individual circles represent outliers of mean monthly temperature recorded for individual loggers.
