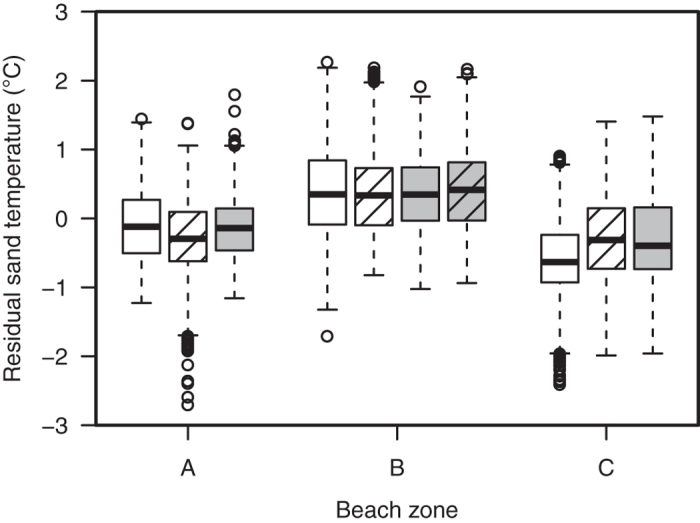
Figure 3. Residual sand temperatures for each beach zone.

Loggers of all sites are pooled together by beach zone and by depth (30 cm: white boxes; 50 cm: stippled white boxes, 70 cm: grey boxes; 80 cm: stippled grey box). The loggers placed in the sites partially shaded in vegetation above the Spring HWL (B) recorded warmer temperatures than the loggers in the sites partially shaded on the open beach at the Spring HWL (A) or in the sites heavily shaded in the vegetation above the Spring HWL (C) over the entire study period (χ2 = 3688.8, df = 2, p < 0.001). The horizontal lines indicate the median temperature; boxes define upper and lower quartiles and whiskers show the data range; individual circles represent outliers.
