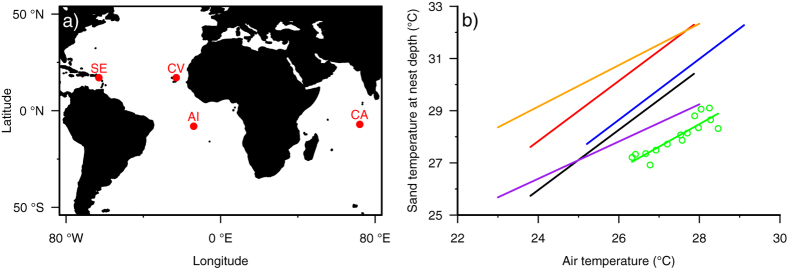
Figure 4. Mean sand temperature versus mean air temperature for rookeries in the Atlantic, Caribbean and Indian Ocean where the same methodologies have been employed.
(a) Locations of sites in: the Caribbean–St Eustatius (SE); the Atlantic--Ascension Island (AI) and Cape Verde (CV); and the Indian Ocean–Chagos Archipelago (CA). This figure has been created in R57 using the Rworldmap package59. (b) Each point for Chagos Archipelago (in green) represents a mean monthly sand temperature value recorded across all loggers combined. The least squares fit regression equation for Diego Garcia is: mean monthly sand temperature = 0.87 x mean monthly air temperature +4.25. Regression lines are shown for: the dark-coloured beaches (in orange) and light-coloured beaches (in purple) of Ascension12; the dark-coloured beaches (in red) and light-coloured beaches (in black) of Cape Verde29; and St Eustatius14 (in blue).

