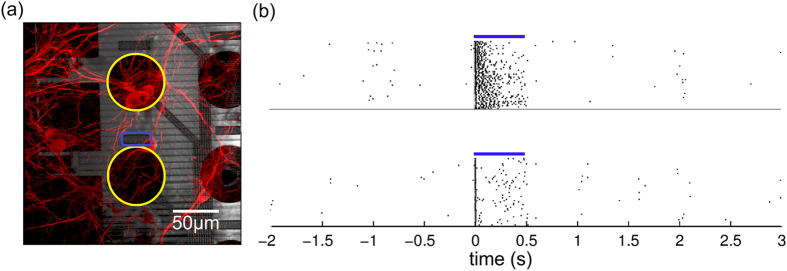
Figure 9.
(a) Confocal image of part of the chip with transduced neurons and (b) rasterplots of the neuronal activation of two depicted contacts (in yellow), when stimulating through the optrode (in blue). Blue lines indicate light ON. The smaller latency of the measured activity on the bottom contact suggests recording of direct activation of the neuron on top of the optrode. The larger latency of the measured activity on the top contact suggests indirect (synaptic) activation of the neuron(s) on this contact.

