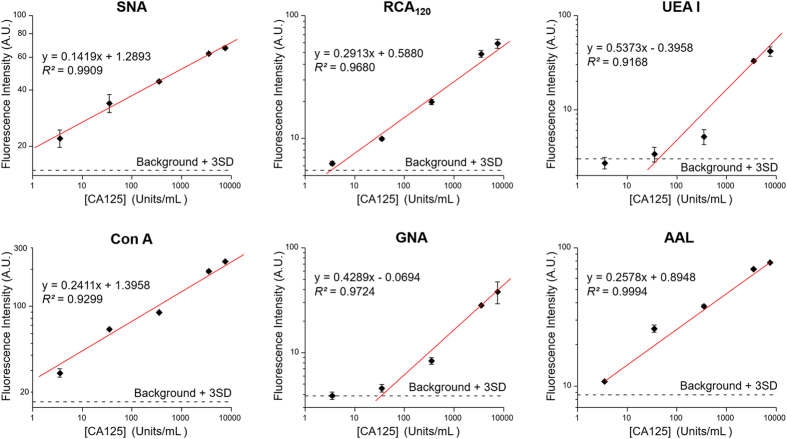
Figure 6. Evaluation of quantitative detection of CA125.
The lectins were selected to target various glycan structures on CA125 obtained from the ovarian cancer cell line according to the glycan profiling results shown in Fig. 5. The calibration curves were obtained by the least-squares fitting. Error bars indicate S.D. (n = 3).

