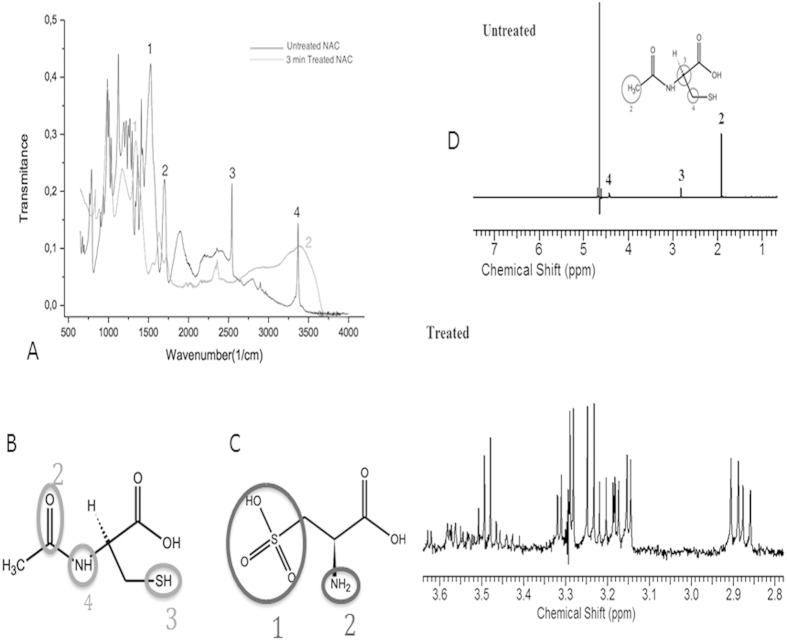
Figure 3. FT-IR and NMR analysis of plasma treated NAC.
(A) A graphical and schematic diagram showing specific peaks representing NAC molecule in untreated NAC solution, and cysteic acid molecule as a product of NAC in consequence of 3 minute plasma treatment of NAC solution. (B) Peaks of untreated NAC molecule at 3375 cm−1, 2547 cm−1, 1718 cm−1, and 1535 cm−1 (from Fig. 3A) correspond to the stretching motion of N–H in CONH group (shown with number 4 in spectra and on molecule), S–H (number 3), C = O (number 2) and CONH group, respectively. (C) New peaks after plasma treatment appear at 3600–3000 cm−1 (Fig. 3A; number 2), and 1344 cm−1 (Fig. 3A; number 1), which correspond to the stretching motion of −NH2 and −SO3H, respectively, which suggest the formation of cysteic acid. (D) NMR spectrum of untreated and 3-minute plasma treated NAC solution which shows spin coupling patterns of untreated N-acetyl cysteine (numbered on spectra peaks and molecule), which is being chemically converted to cysteic acid as a result of plasma treatment. Arrows indicate increase in intensity of multiplets found in 3.54–3.61 and 3.24–3.42 ppm. Also, decrease in intensity of the multiplet located at 2.95–3.01 ppm was observed. Proton shifts suggest that about 90% of N-acetyl cysteine is converted to cysteic acid via cleavage of the thiol group.

