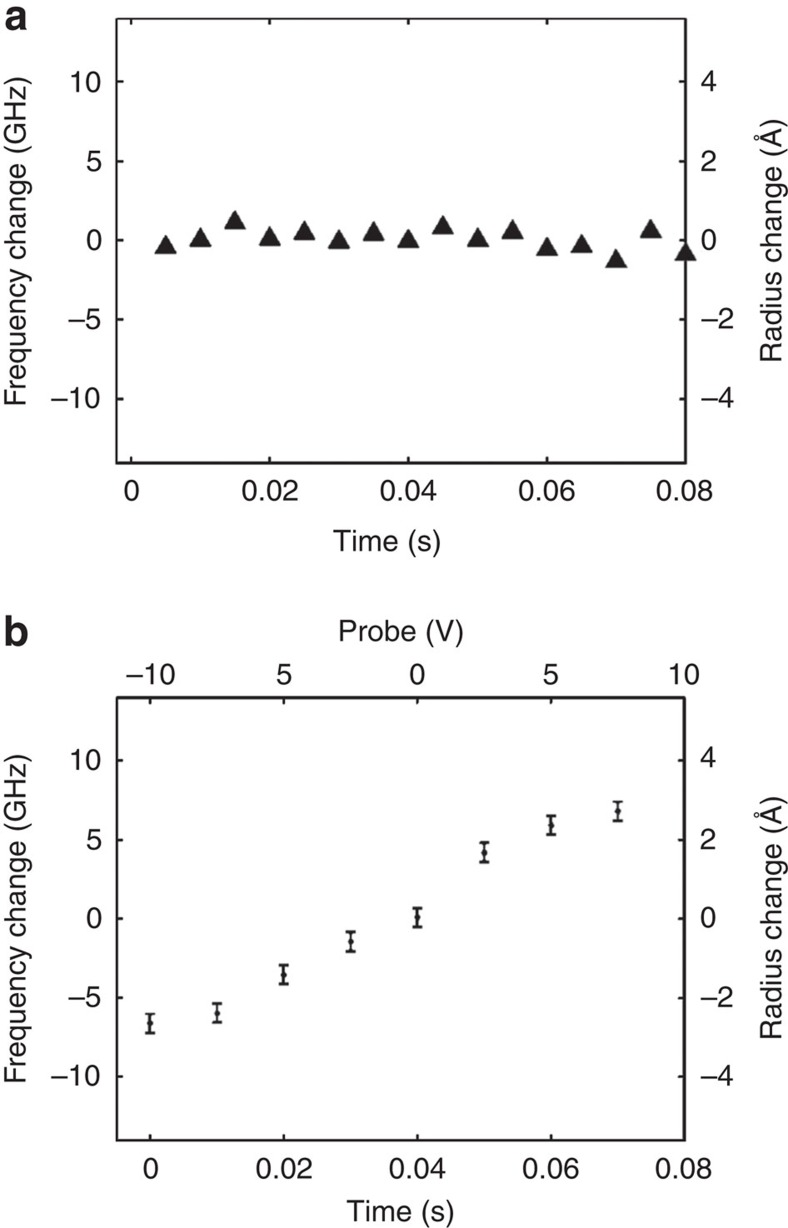
Figure 3. Experimental results.
(a) Monitoring the droplet size through its resonance frequency reveals a s.d. of 0.3 Å in radius during a 0.08 s period. Parameters here are similar with the ones in Fig. 2c where the resonance frequency is revealed from the centre of the best-fitting Lorentzian (red line, Fig. 2c). (b) Controlling the water-droplet size and its resonance frequency by applying an external voltage. Parameters are similar to (a) except for an electrode here that was located 300 μm from the droplet. The error bars in (b) represents the s.d. when voltage was not applied (a). We note that the water reservoir is always grounded.

