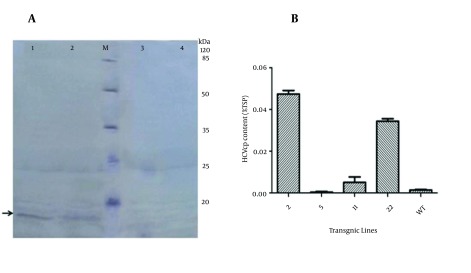
Figure 5. Western Blot and ELISA Analysis.
A, Western blot using an anti-His antibody; lanes 1, 2, 3: transgenic lines no. 2, 22, and 11, respectively; lane M: prestained protein ladder; lane 4: non transgenic plant; B, Quantitative analysis of HCVcp in transgenic Brassica seeds using sandwich ELISA. The amount of HCV core protein in TSP was calculated using purified HCVcp as a standard. Each bar represents an average of three repetition ± standard error.

