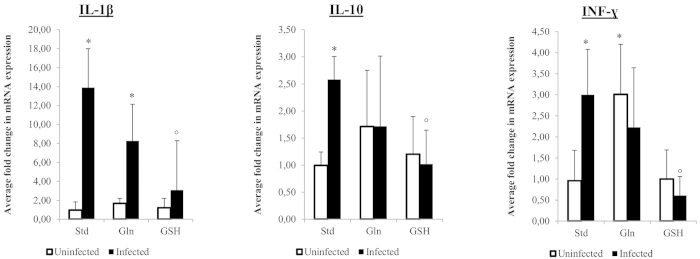
Figure 7. Fold change in cytokine expression in control and Helicobacter suis infected animals.
An *indicates a significant difference in infected animals compared to the negative control animals receiving the standard diet. An °indicates a significant difference in expression compared to H. suis infected animals receiving the standard diet (p < 0.05). Std: animals receiving the standard diet; Gln: Glutamine-supplemented diet; GSH: Glutathione-supplemented diet.

