
Figure 2. Time course of photosynthetic responses after changes in light intensity in PGR5-knockdown plants, crr6 mutant plants, and WT plants.
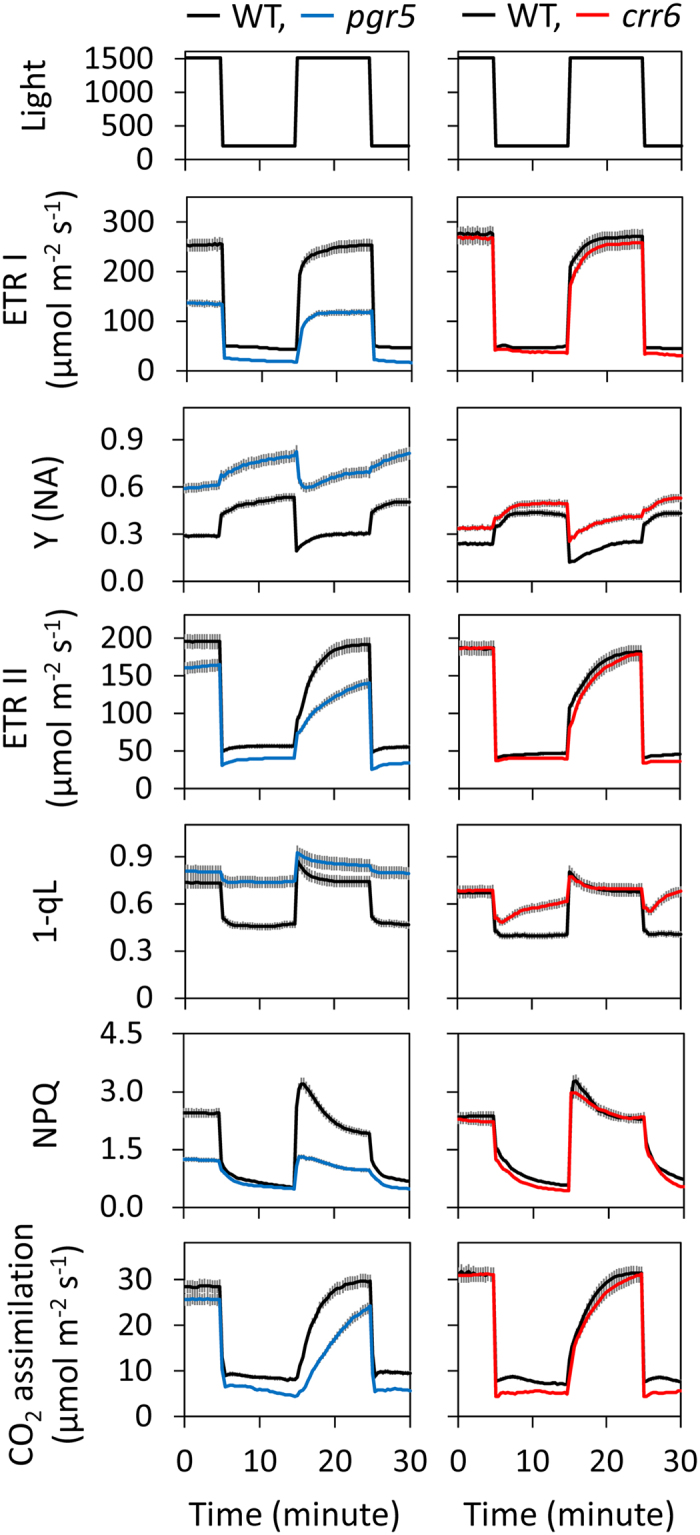
The same fluctuating light regime as in Fig. 1 was used. We simultaneously measured the electron transport rate around PSI (ETR I) and around PSII (ETR II), CO2 assimilation rate at a CO2 concentration of 400 μmol mol–1, the fraction of PSI reaction centers that are closed owing to acceptor side limitation (Y(NA)), the redox state of the plastoquinone pool (1-qL), and non-photochemical quenching (NPQ). The graphs compare PGR5 KD plants with their WT (Oryza sativa cv. Nipponbare), and crr6 mutant plants with their WT (Oryza sativa cv. Hitomebore). Values are means ± SE, n = 5 or 6.