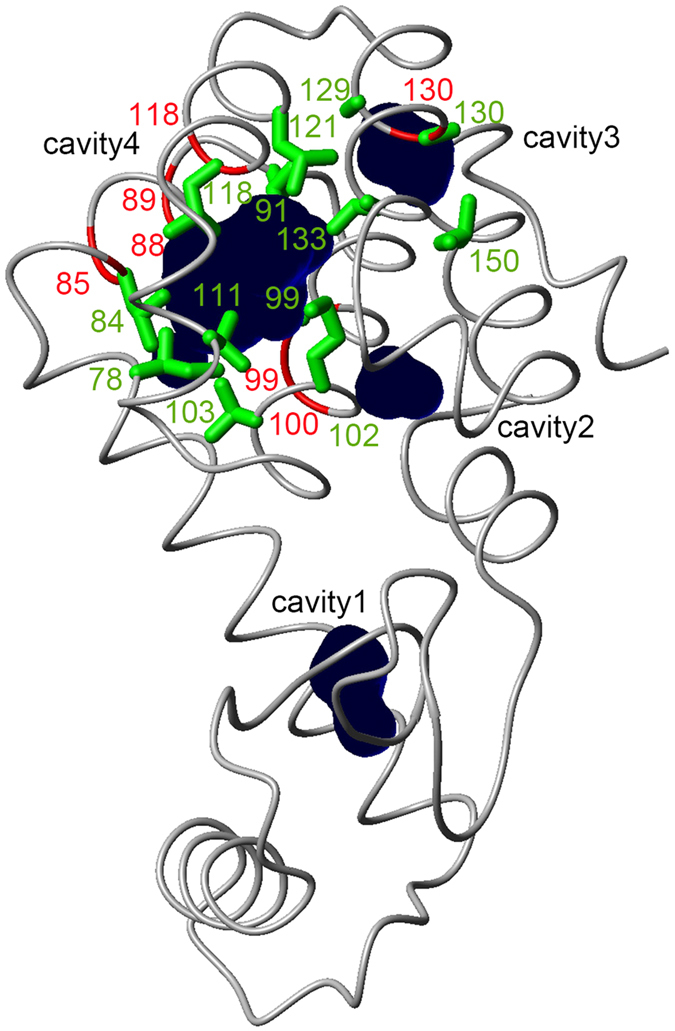
Figure 2. Three-dimensional structure representations of T4 lysozyme L99A, highlighting the locations of amide (red) and methyl (green) groups showing oxygen-induced chemical shift changes or a loss of crosspeak intensity.

Cavities calculated by the program MOLMOL62 are depicted by dark blue spheres.
