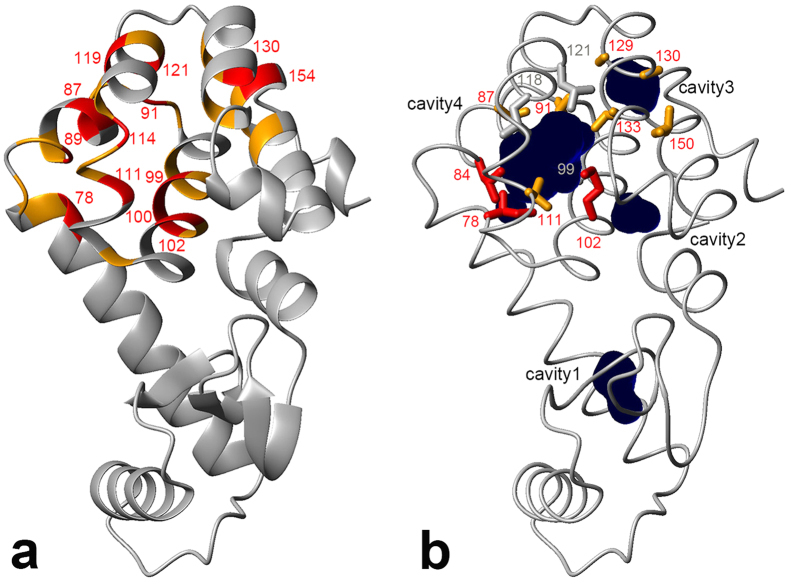
Figure 5.
(a) Mapping of amide groups showing 1H longitudinal relaxation enhancements (ΔR1 ≥ 4 s−1, red; 2 s−1 ≤ ΔR1 < 4 s−1, orange). Data were obtained at 6.4 mM of O2 concentration. Amide groups showing large relaxation enhancements (ΔR1 ≥ 4 s−1) are labeled with residue number. (b) Mapping of methyl groups showing 1H longitudinal relaxation enhancements (ΔR1 ≥ 10 s−1, red; 4 s−1 ≤ ΔR1 < 10 s−1, orange). Data were obtained at 3.8 mM of O2 concentration. Methyl groups showing severe line-broadening are depicted by gray sticks. The picture was prepared using MOLMOL62.

