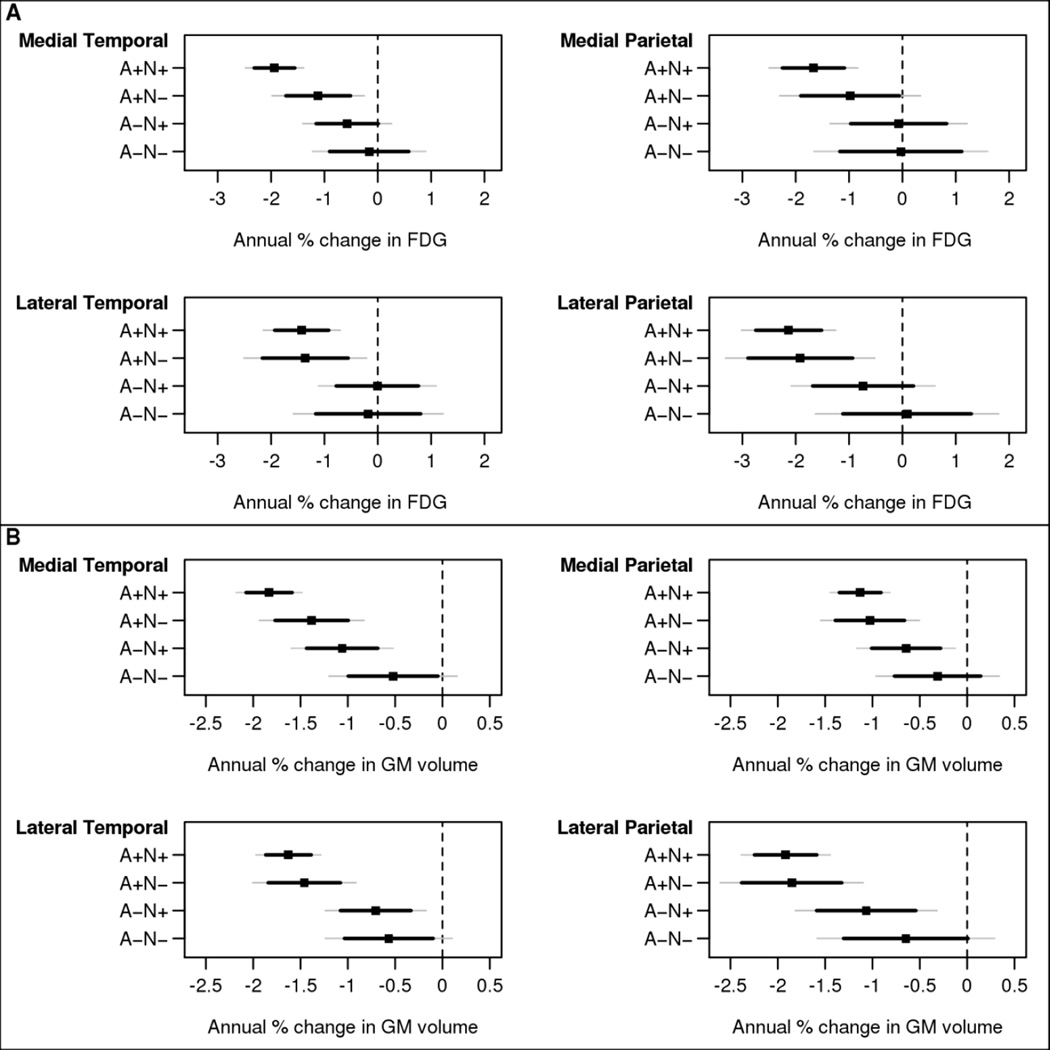
Figure 3.
Estimated annual percentage change for FDG SUVR (A) and grey matter volume (B) with 95% confidence interval (CI) (thin gray lines) and 84% CI (thicker black lines) by biomarker group for primary ROIs: medial temporal, medial parietal, lateral temporal and lateral parietal. The 84% CI allows for visual comparisons between groups where any amount of overlap indicates a lack of significance at the 0.05 level. Estimates are from a linear mixed model for a participant age 80 years. Statistical tests: FDG value by ROI for comparison of A+N+ versus A−N+: lateral temporal, p=0.03; medial temporal, p=0.007; medial parietal, p=0.04; lateral parietal, p=0.09. For comparison of A+N+ versus A−N−: lateral temporal, p=0.12; medial temporal, p=0.004; medial parietal, p=0.08; lateral parietal, p=0.02. All other contrasts not significant. GM volume: for comparison of A+N+ versus A−N+: lateral temporal, p=0.005; medial temporal, p=0.02; medial parietal, p=0.12; lateral parietal, p=0.06. For comparison of A+N+ versus A−N−: lateral temporal, p=0.006; medial temporal, p=<0.001; medial parietal, p=0.03; lateral parietal, p=0.02. All other contrasts not significant.

