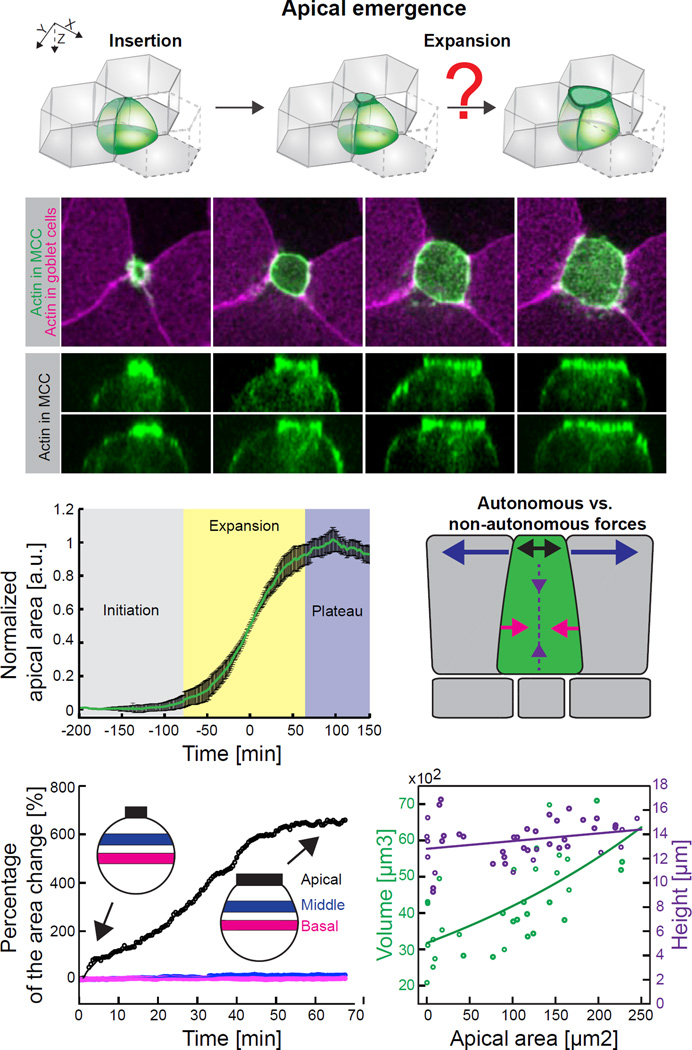
Figure 1. Apical emergence is selectively driven in the apical region of nascent multiciliated cells (MCCs).
(A) Schematic of the apical emergence process. Upon insertion at the tricellular junction, a MCC precursor (green) expands its apical surface within the surrounding goblet cells (grey). (B) Image sequence of apically emerging MCC expressing actin marker – utrophin (UtrCH, green) under MCC specific α-tubulin promoter; goblet cells visualized by expression of UtrCH-RFP (magenta) under goblet specific nectin promoter. (C) Orthogonal projections, corresponding to (B), of apically emerging MCC (visualized by α-tubulin UtrCH-GFP. (D) Three phases of apical area expansion process. Data represent mean (green line) and variance (black bars), n = 9 cells from 9 embryos. (E) Schematic of potential autonomous forces (baso-lateral constriction, red arrows; apico-basal squeezing, purple arrows; apical pushing, black arrows) and non-autonomous forces (neighboring pulling, blue arrows) that might contribute to apical expansion process. (F) Representative surface area dynamics of the apical (black), middle (blue) and basal (red) region of MCC during apical emergence. Percentage of surface area change is calculated as a ratio of the surface area at the consecutive time point to the surface area at the beginning of the emergence process. Inserts – schematic of MCC at the beginning and at the end of the apical emergence process; average percentage changes of surface areas at given region and SD are: Apical side 618.5 ± 28.03%, Middle side 23.99 ± 28.95%, Basal side 3.24 ± 5.15%, n=5 cells from 5 embryos. (G) Volume (green) and height (purple) changes of MCCs throughout apical emergence process. Scale bar, 10µm. a.u., arbitrary units. See also Figure S1 and Figure S2.

