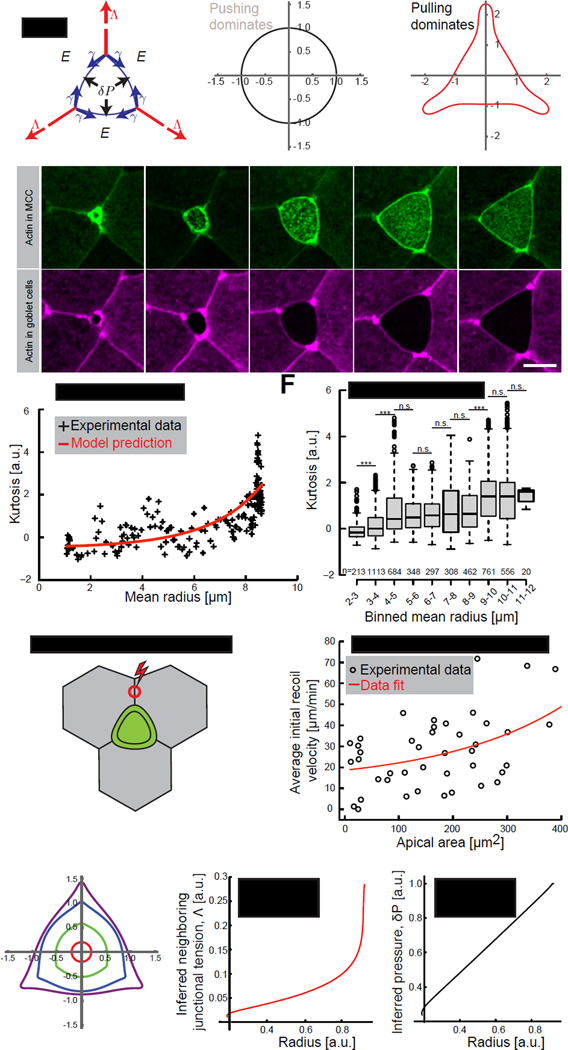
Figure 3. MCC-generated pushing forces majorly drive apical expansion process.
(A) Schematic of the theoretical model of forces acting on an apical domain of a MCC. Apical domain expanding forces: effective 2D pressure, δP (black arrows) and neighboring junctional pulling forces, Λ (red arrows) acting against MCC cortical tension, γ (blue arrows) and elasticity from the surrounding cells, E. (B) Simulation of the MCC apical domain shape upon dominant pushing forces or (C) dominant junctional pulling forces. (D) Image sequence of an apically expanding MCC (visualized by α-tubulin UtrCH-GFP, green) within goblet cells (visualized by nectin UtrCH-RFP, magenta). (E) Experimental (black) and theoretical (red) curvature changes, defined by kurtosis, in time of the cell showed in (D). (F) Kurtosis values for the consecutive apical domain sizes, categorized by binned mean radius, in control cells. Boxes extend from the 25th to 75th percentiles, with a line at the median. P values, Mann–Whitney U test (number of embryos, n>5), ***p<0.001, n.s. – not significant. (G) Schematic of laser ablation of junctions perpendicular to MCC, red circle represents the ablation region (H) Initial recoil velocities upon laser ablation of junctions described in (G). Black circles – experimental data, solid red line – fit. (I) Shape simulation of the MCC apical domain based on the theoretical model. (J) Inferred neighboring junctional tension, Λ and pressure, δP (K) from the simulated shape showed in (D). Scale bar, 10µm. a.u., arbitrary units. See also Figure S4.

