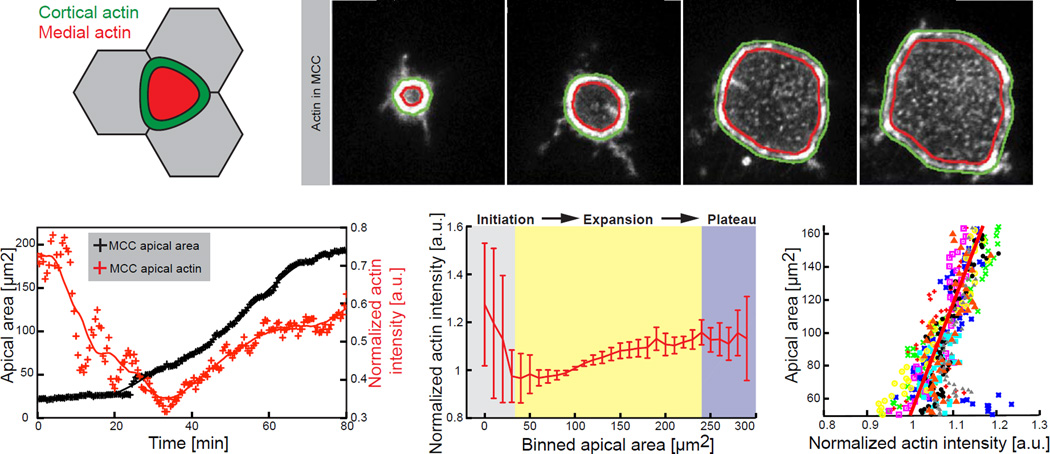
Figure 4. Formation of medial apical actin of MCCs highly correlates with expansion dynamics of the apical domain.
(A) Segmentation schematic of the cortical (green) and the medial (red) region of a MCC within the plane of the exposed apical area. (B) Representative image sequence of automatically segmented cortical and medial region within apically expanding MCC (visualized by α-tubulin UtrCH-GFP). (C) Representative - effective actin (ratio of mean medial to mean cortical actin) dynamics (red) during the apical area (black) expansion process. Crosses, data points; line, data smoothed by factor 5. (D) Effective apical actin concentration for the consecutive apical domain sizes, categorized by binned area, in control cells, n=9 cells from 9 embryos. Data represent mean and variance. (E) Effective apical actin concentration as a function of apical area in control cells, n=9 cells from 9 embryos. Scale bar, 10µm. a.u., arbitrary units.

