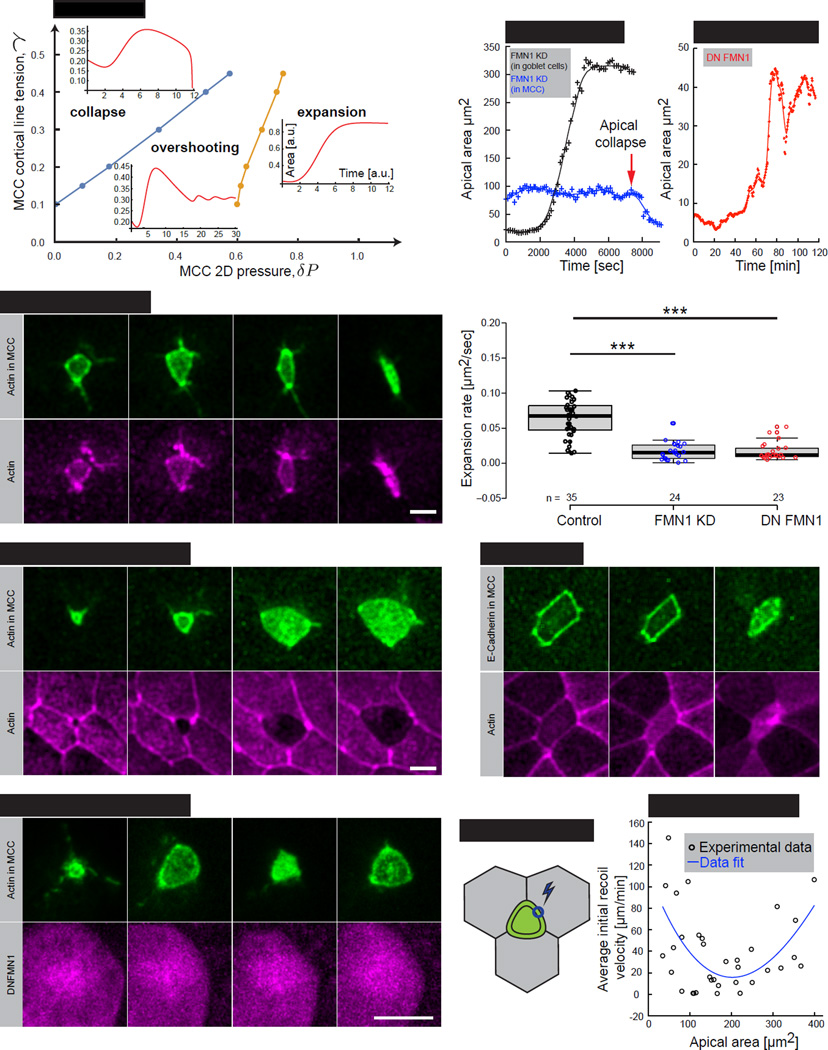
Fig.5. Actin polymerization and subsequent actin network formation drive apical expansion of MCCs.
(A) Phase diagram of possible apical domain expansion dynamics, as a function of target MCC cortical tension γ and pressure δP. A blue and an orange line indicate the transition zones between different phases. Inserts represent simulations of the apical area in time for the three regimes. (B) Image sequence of apically collapsing MCC (4 out of 4 cells), (visualized by α-tubulin UtrCH-GFP, green) upon mosaic co-injection of FMN1 morpholino (FMN1 MO) with UtrCH-RFP mRNA, magenta). Note that FMN1 MO is present only in MCC, as indicated by UtrCH-RFP mRNA expression (C) Image sequence of apically expanding MCC (visualized by α-tubulin UtrCH-GFP, green) upon mosaic co-injection of FMN1 morpholino (FMN1 MO) with UtrCH-RFP mRNA, magenta). Note that FMN1 MO is present only in goblet cells and that MCC expands normally (4 out of 4 cells). (D) Image sequence of MCC (visualized by α-tubulin UtrCH-GFP, green) expressing dominant negative FMN1 (DNFMN1, visualized by α-tubulin DNFMN1-RFP, magenta). (E) Apical area dynamics of MCC upon mosaic injection of FMN1 MO (black – FMN1 MO present in MCCs only (showed in (B)), blue – FMN1 MO present in goblet cells only (showed in (C)). (F) Apical area dynamics of MCC expressing dominant negative FMN1 (DN FMN1), representing an “overshooting” regime within the phase diagram. (G) Apical expansion rate during linear growth phase in controls (black), MCCs FMN1 KD (blue), and MCCs expressing dominant negative FMN1 (DN FMN1), number of embryos, n>15. Boxes extend from the 25th to 75th percentiles, with a line at the median. P values calculated with Mann–Whitney U test, ***p<0.001 (H) Image sequence of apically collapsing MCC (visualized by α-tubulin E-Cadherin-GFP, green) within goblet cells (visualized by nectin RFP-UtrCH, magenta) upon treatment with 50µm of SMIFH2. Time indicates minutes after drug addition to the medium. (I) Laser ablation schematics of MCC junctions, blue circle represents the ablation region. (J) Initial recoil velocities upon laser ablation of MCCs junctions described in (J). Black circles – experimental data, solid blue line – fit. Scale bar, 10µm. a.u., arbitrary units. See also Figure S5.

