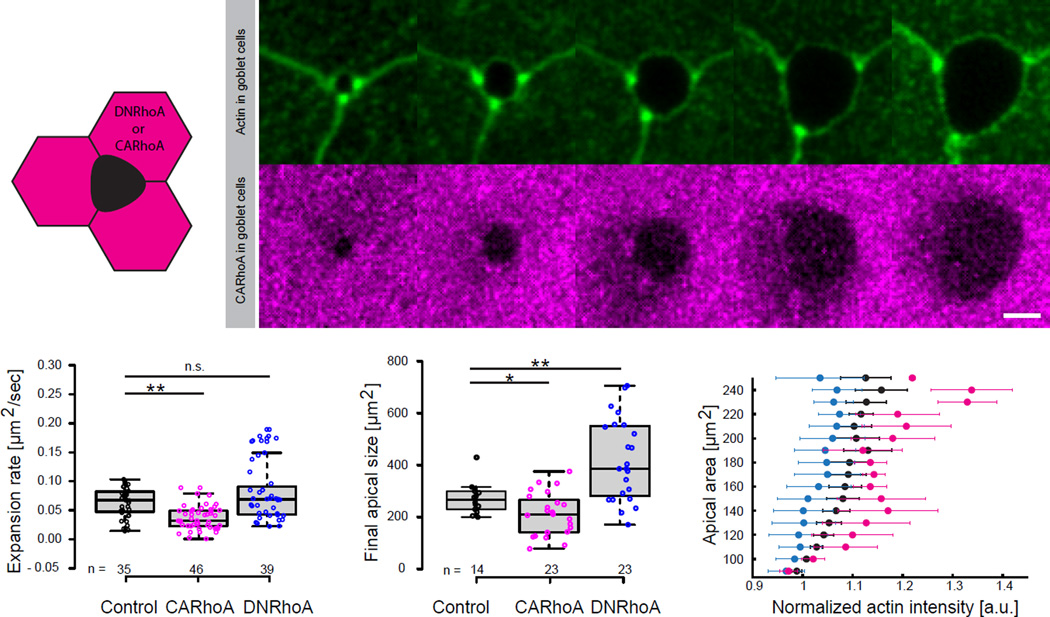
Figure 6. Apical emergence of MCCs is influenced by external rigidity of the surrounding cells.
(A)Schematic of nectin driven expression (goblet cells specific) of DNRhoA or CARhoA. (B) Image sequence of apically expanding MCC, outlined by expression of UtrCH-GFP under nectin promoter (top, green), within goblet cells expressing CARhoA under nectin promoter (bottom, magenta). (C) Apical expansion rate during linear growth phase in controls (black), MCCs surrounded by goblet cells expressing -CARhoA (magenta), -DNRhoA (blue), **p<0.01, n.s. – not significant. (D) Final size of the apical domain of MCCs for experimental conditions described in C, **p<0.01, *p<0.05 (E) Effective apical actin concentration in MCCs as a function of apical area in controls (black crosses), MCC surrounded by goblet cells expressing: CARhoA (magenta), DNRhoA (blue); data represent mean and variance (number of embryos, n>5). Boxes extend from the 25th to 75th percentiles, with a line at the median. P values, Mann–Whitney U test (number of embryos, n>5), n.s., not significant. Scale bar, 10µm. a.u., arbitrary units.

