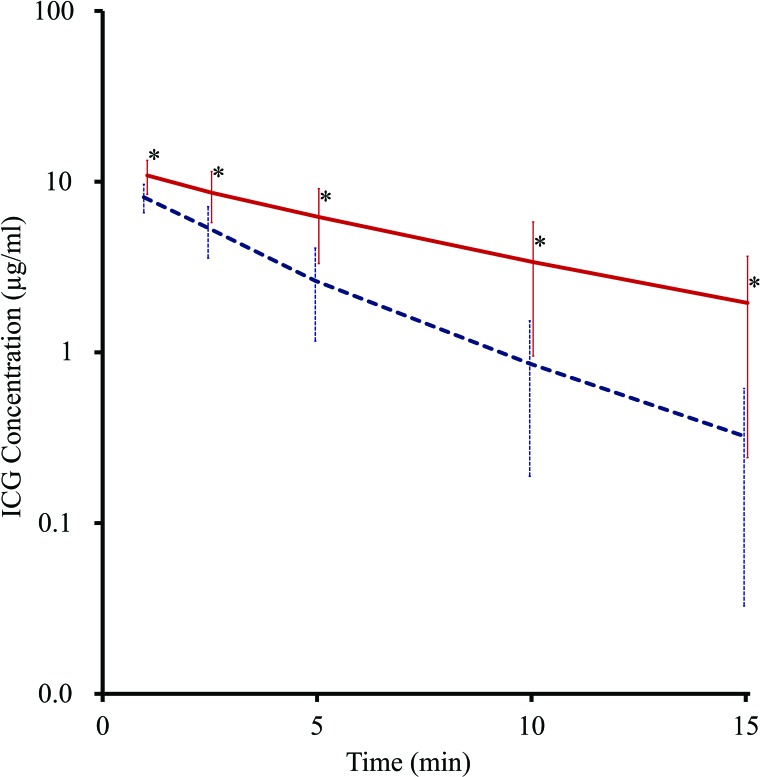
Figure 3.
Time course change of indocyanine green (ICG) concentration. Time course change of ICG concentration of nonalcoholic steatohepatitis (NASH) (solid red line, n = 6) and normal (dashed blue line, n = 6) rats. Bars indicate SD, and asterisks indicate statistical significance (p < 0.05). The half-life of ICG was calculated from the slope, and that of the NASH rats was significantly longer than that of normal rats (5.04 ± 2.1 min vs. 2.72 ± 0.7 min; p < 0.05).

