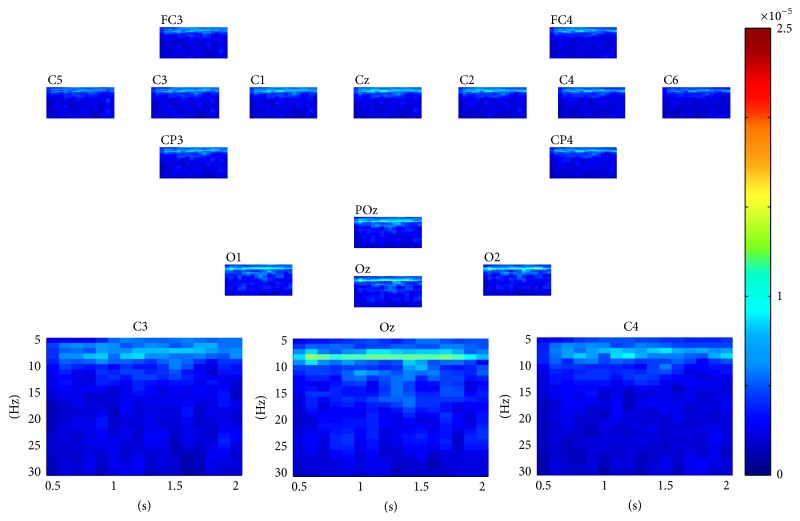
Figure 6.
A visualization example of the assembled tensor for a SSVEP task (focusing on the 8 Hz stimulus). The spectrograms are shown at each channel according to channels distribution over scalp, with time ranging from 0 to 2 s and frequency ranging from 5 to 30 Hz. The spectrograms at C3, Oz, and C4 channels are enlarged in the bottom.

