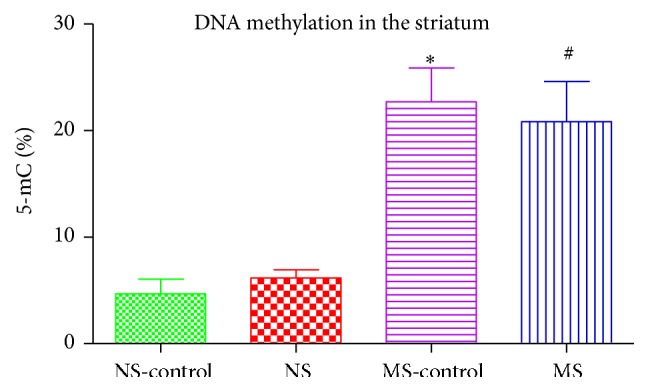
Figure 3.

Graph showing % 5-mC in the striatum of nonstressed saline lesioned rats (NS-control), nonstressed rats (NS), maternally separated saline lesioned rats (MS-control), and maternally separated rats (MS): ∗(NS-control versus MS-control) P < 0.05; #(NS versus MS) P < 0.05.
