Figure 3.
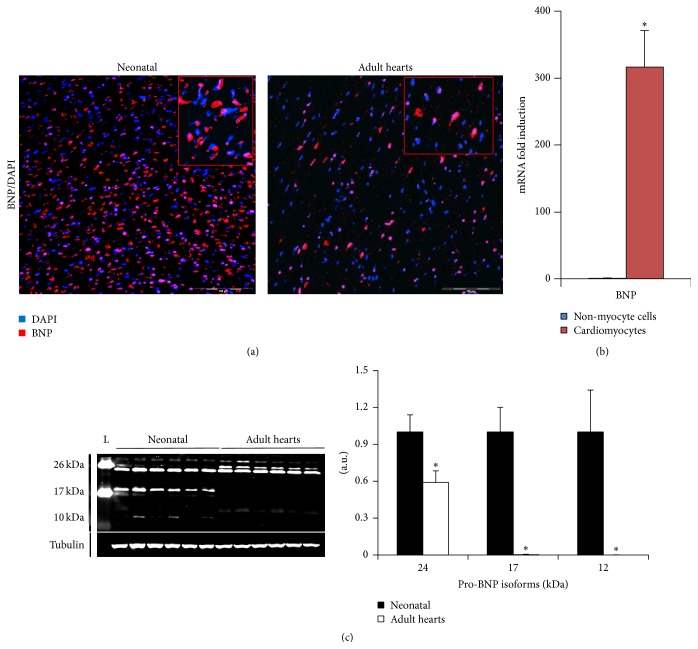
Heart expression of BNP is age-dependent and cell specific. (a) Representative microscopy pictures of neonatal and adult hearts stained for BNP (in red) and DAPI (nuclei in blue). High magnification of positive cells in top right inserts. The scale bars represent 100 μm. (b) mRNA expression of BNP using quantitative PCR, in non-myocyte cells (NMCs) (blue) and cardiomyocytes (red). Results expressed as fold-increase above the levels in NMCs. n = 7 cardiomyocyte samples compared to 9 NMC samples. Data are means ± SEM, ∗ P < 0.05. (c) Determination of BNP protein levels in neonatal and adult hearts by western blot analysis. BNP protein expression with representative western blot and quantification relative to tubulin, expressed as fold changes relative to the average level of neonatal hearts. Data are means ± SEM, ∗ P < 0.05. a.u.: arbitrary unit.

